The inverted space of the US debt curve will also deepen
Author:Economic Observer Time:2022.08.11

Zhang Tao Lu Siyuan/Wen
Since mid -June, the US bond market has changed significantly, and the front -end yield of the US debt curve has continued to follow the US Federal Reserve's policy interest rates, but the yields of US debt in each period or above have fallen to varying degrees. Further deepening, and the Federal Reserve's policy environment is still in the continuous tightening cycle, changes in the US debt curve more reflect the market's expected changes in economic prospects. Will this change affect the Fed's judgment? For example, the current potential economic recession information that has deepened the degree of inverted US debt spreads has become an important factor affecting the U.S. bond market market outlook.
First of all, changes in the form of US debt curve fully reflect the market's expected adjustment of the market and Fed policy path.
Although the Federal Reserve raised interest rates at 75bps again at the July interest rate meeting, the 10 -year US debt yield continued to continue the downward trend after the June meeting. At present, the 10 -year US debt yield has fallen from 3.5%in mid -June. By 2.8%(the lowest time to below 2.6%), at the same time, it is different from the US debt yield curve since the Fed started the interest rate hike cycle in March. The degree of inverted curve has been deepened, and the difference between 10-year and 2-year US debt yields is close to -50bps. The spread also dropped from the peak of 220bps to the nearly 10bps (the minimum narrowing to the near 0).
Figure 1: The form of the US debt curve changes
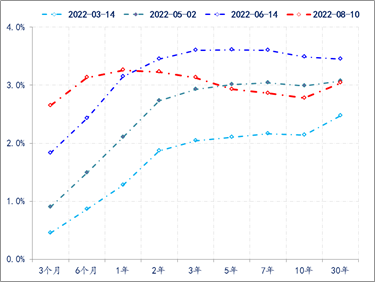
Data source: wind
The changes in the shape of the US debt curve and 10 -year US debt yields must reflect the market's expectations of the market's expected US economic operation and Federal Reserve policy. To this end, further observations need to be further observed to promote the changes in the return rate of US debt yields in the near future. For example, the 10 -year US debt yield can be simply decomposed into actual yields and inflation expectations. The former focuses on the market's expectations of the market for economic prospects, and the latter is related to the policy path of the Fed. Of course, the two will also affect each other. For example, good economic prospects are generally accompanied by inflation expectations, and poor economic prospects are generally accompanied by inflation expectations. However, there are also "two situations" caused by special reasons. For example, the recent one is that since the epidemic, the inflation expectations implied by 10 -year US debt yields are expected to go up all the way, from 0.5%to a maximum of 2.9%, but the representatives at the same time during the same period The 10-year-old US debt TIPS yield is expected to minimize from 0.5%to -1.2%, reflecting the continuous understanding and continuous pricing of the market's impact on the epidemic and Ukraine crisis. It has not been moved to change the policy environment, and it also helps to push inflation expectations to a certain extent.
The above situation continued until November last year. After that, the Fed first abandoned temporary inflation judgment, and gradually established the path of changing the policy environment: reduced the scale of debt purchase (TAPER) -> rate hike-> reduced the balance sheet (Qt). In this regard, the market has also fully confirmed that after the start of the interest rate hike cycle in March, the implicit inflation expectations of the US bond market began to fall. %, The United States service industry continued to restore, the U.S. unemployment rate continued to stabilize at a low of 3.6%, while U.S. debt TIPS was pushed back under economic data such as strong employment, and in mid -June has risen to nearly 0.7%.
However, after the Federal Reserve raising 75bps at the June meeting, the 10 -year US debt TIPS yield has begun to reverse, and it is currently re -falling to nearly 0. It reflects that the market is beginning to worry about the US economic recession and eventually adjust the policy path in advance, end interest rate hikes in advance, and may even start the downturn cycle earlier.
Figure 2: U.S. Top 10 years of US debt implication inflation expectations and TIPS (2020-2022)

Data source: wind
Secondly, this round of interest rate hike is related to the two curves of the Federal Reserve policy basis
At present, the pricing of the Fed's policy path in the market is: the Fed will turn to interest rate cuts in the first quarter of 2023, and the interest rate line map announced by the Fed in June shows that in 2022, 2023, and 2024 Until 3.4%, 3.8%, and 3.4%, the Fed itself is expected to cut interest rates in 2024. It is clear that the market believes that the Fed will not raise interest rates in accordance with the established path, especially the US GDP for two consecutive quarters of negative growth, which has strengthened the economy that has strengthened the economy Slowly worry.
However, the structure and total situation of the US employment market currently show that the Fed's anti -inflation task is far from complete.
First, in terms of employment market structure. As of June, the vacancy rate of non -agricultural positions in the United States is still as high as 6.6%, and since April 2020, the Bellych curve of the US employment market has continued to deviate from the basic state before the epidemic. At a historical low of 3.6%, the vacancy rate of non -empty positions in the United States is still much higher than the level of vacancy corresponding to the same unemployment rate, exceeding the range of nearly 3 percentage points. In addition to the impact of 1 percentage point lower than the epidemic before the epidemic, frictional unemployment and structural unemployment are the main causes of imbalance in supply and demand in the US employment market. Factors such as salary and salary consumption and supplementation of residential revenue for multiple rounds of financial bailout are still increasing the structural changes in the employment market. Figure 3: The United States Beverich (2002-2022)
Data source: wind
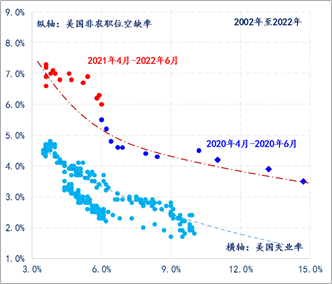
Note: The Beverich curve is named after British economist Beverch, which is used to indicate the change of job vacancies and the number of unemployed people. It is generally used to observe the structural changes in the employment market.
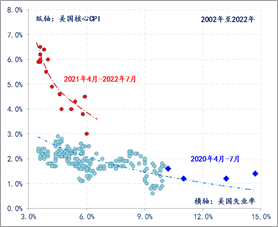
Second, in terms of the total number of job markets. Since the financial crisis in 2008, the increasingly flat Philips curve has allowed the Federal Reserve to worry about inflation when implementing a loose policy, and the dual -mission of the Federal Reserve's prices should gradually concentrate on the maximum employment of employment. A single goal. In August 2020, the Fed further adjusted the policy framework into an average inflation target system, which greatly improved the tolerance of inflation. The actual inflation of the United States was separated from the target of 2%within a certain period of time. 2%inflation to add the gap that has been shrinking to the economy since 2012.
In the early days of the impact of the epidemic, the actual situation of inflation and employment groups in the United States was still in the area of flat Philips curve. Therefore, there is no need for the Federal Reserve to return to zero interest and implement unlimited and loose stimulation policies. However, under the influence of the impact and demand that was stimulated, since April 2021, the US Philips curve is rapidly steep. So far, the curve slope is close to the historical peak, reflecting the current high inflation and the overheating of the employment market.
Figure 4: US Philip Coster (2002-2022)
Data source: wind
The above -mentioned changes in the structure and total number of U.S. employment markets have shown that the task of resolving inflation through interest rate hikes and low demand is far from complete. Before the cooling, that is, before the return of the position of the position to the normal area, the inflation pressure is difficult to cause fundamental relief. The structural adjustment of the employment market with a decrease in vacancy will definitely bring a sharp rise in the unemployment rate.
Third, the 2%inflation target demand requires the Federal Reserve's higher level of interest rate hike end
Since June, the Fed has continued to weaken forward -looking guidance and continues to emphasize the dependence of policy paths on data.
First, the Federal Reserve announced the economic forecast (SEP) including information on interest rate dot maps at the end of each quarter. At present, the latest economic forecast of the Federal Reserve is the announcement of the June interest rate meeting. The end point was 3.8%in 2023, and the actual marketing of the market was lower than this level after mid -June.
Second, the historical practice of the Federal Reserve policy, such as "the Fed's Dalismal Pickups". Since the Fed's release of policy signals in November last year, US stocks have continued to decline. As of June 16, the S & P 500 Index fell 23.5%and the Nasdaq index fell 33.4%. Bounce, the S & P 500 index has rebounded 14.8%, and the Nasdaq index has rebounded by 20.7%. The current rebound of U.S. stocks undoubtedly reflects that the market still believes that the Federal Reserve is still valid.
Figure 5: The S & P 500 Index and the Nasdaq Index (2020-2022)
Data source: wind

The downside of the US debt curve and the above two points reflect that the market generally expects that the Fed will not significantly increase its affordability to economic downturn and market decline in this tightening cycle. But from the current status of the US employment market, I am afraid that the path of the Federal Reserve's prediction of the Federal Reserve's predictability may have a large deviation with the actual path of the Federal Reserve.
The reason for the deviation is that the Fed must greatly increase the policy interest rate in order to control the increase in inflation, and even so, it will take a certain time, so that the US employment market and the US economy will definitely appear very significant adjustments, that is, the original The cost of controlling inflation will be high. In addition, in view of the reimbursement of the supply side, it will not be smooth, and the economic ups and downs during the period will force the Federal Reserve to adjust the rhythm of the policy. The reasons for strengthening policy flexibility.
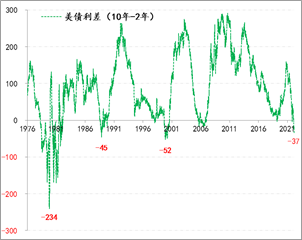
Based on the deduction of the above three levels, our current understanding is: with the continuous interest rate hike of the Fed, the front -end interest rate of the US debt curve will follow the policy interest rate.This will further deepen the degree of inverted US debt curve, that is, the US debt curve will eventually confirm the "stagnation" of the economy.During the last period of the U.S. economic stagnation, 10-year and 2-year US debt yields have the largest contrary to -234bps, and under multiple rounds of inflation, the US debt curve also appears in multiple depth inversion.Data may be paid attention and referenced by the market with the Fed's expected expansion.Figure 6: The spread of 10-year and 2-year US debt (1976-2022)
Data source: wind
(The author works for the Financial Marketing Department of China Construction Bank. This article only represents the author's point of view)
- END -
Shandong Digital Economy helps rural revitalization to insert "cloud wings" for agricultural products

Volkswagen.com · Poster reporter Tian Tian Tian Zaozhuang reportA few days ago, i...
Zhoukou Housing Provident Fund Center: Actively adjust the policy to help the property market healthy development
Zhoukou Daily · Zhou Dao client reporter Xu QifengAfter Zhoukou issued the Several Opinions on Making Steady and Healthy Development of the Real Estate Market, Zhoukou Housing Provident Fund Center