Through carbon satellite monitoring, we found that China's carbon exchange capacity is indeed undervalued | Liu Yi
Author:Institute of Geological Earth Time:2022.08.06

"
Hope at the next stage,
Facing very fierce international competition,
Our Chinese scientists can use collective wisdom,
It will be fully combined from top to bottom and bottom to top,
Realize our "double carbon" strategic goal.
Researcher at the Institute of Atmospheric Physics of the Chinese Academy of Sciences of China
Gezhi Tao Tao 83 | June 25, 2022 Beijing
I am very happy to come to the Ge Zhi Tao Tao. Today I shared the title of "Carbon Satellite: Insight Carbon Footprint", which will introduce you how the satellite goes to achieve the goal of insight into carbon footprints.

Data source: Equal temperature data, NASA/GISS surface temperature data, RIGNOT et al. 2019 ice sheet data, National Ice and Snow Center Sea Ice Data data
There are four curves in this picture: the first curve shows the changes in global surface temperatures over the past 100 years, and the second article gives changes in marine calories. Everyone sees that they continue to rise, and they are in line with the existing feelings and discovery. The other two blue curves show a downward trend, which reflect the changes in the Arctic sea ice and Greenland ice sheet, indicating that the scope and quality of the sea ice and ice sheets are decreasing. Such changes are caused by human activities: carbon dioxide is an important source of heating, and global warming has become an unavoidable fact.
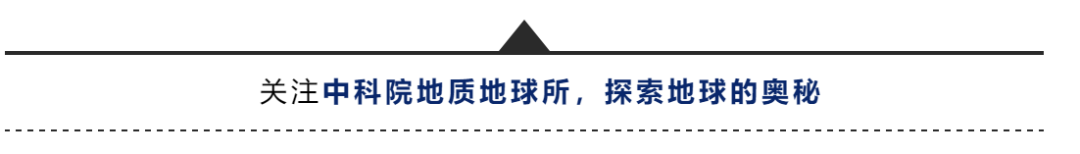
When did humans recognize the heating effect of carbon dioxide? You can see that 1861 is a key node, and Dou Duo found that carbon dioxide is a key factor in climate change on the earth. In 1975, Zhen Guo Shulang proposed the world's first three -dimensional atmospheric circulation model, and accurately calculated the global temperature changes that the atmospheric carbon dioxide content would double. He also won the 2021 Nobel Prize in Physics.
It is not difficult to see that combined with the curve, with the rapid rise of carbon dioxide emissions, the scientific community has been conducting ground observations of carbon dioxide since 1958. Looking back, Japan launched the first carbon dioxide detector to space in 1996, and then in 2002, Europe launched a short -wave infrared detector -these two detectors opened a new new human satellite monitoring carbon monitoring carbon. path.
In order to more accurately monitor the distribution of global carbon dioxide space, in 2009, Japan launched a greenhouse gas observation satellite "breathing" (GOSAT), and in 2014, the United States launched rail carbon observer 2 (OCO-2). In 2016, the carbon satellite (TANSAT) independently developed in my country also successfully operated. These three satellites have begun quantitative carbon monitoring.
The latter curve presents different scenes in the future. This is related to how human beings are restrained to the goal within 2 degrees, and the monitoring of carbon dioxide plays a very important role in it.
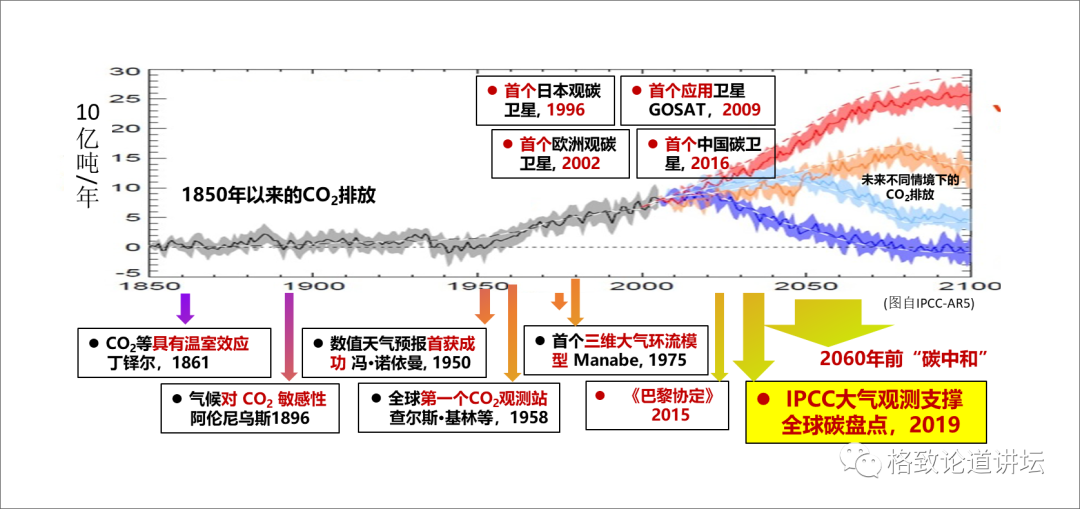
Everyone knows that the so -called carbon neutrality should be considered from two aspects of carbon emissions and absorption. It mainly emphasizes human emissions, but there are still a large part of natural emissions and absorption will also participate in the final balance. I am very proud to share with you two masters from the Institute of Atmospheric Physics of the Chinese Academy of Sciences. They are also the viewers of the National Supreme Science and Technology Award.
Ye Duzheng World View: Human beings orderly adapt
Zeng Qing Cun Method Theory: Natural Control theory
One is Mr. Ye Duzheng, who proposed the world view of "human beings must adapt to the effect of carbon neutrality in order to achieve the effect of carbon neutrality" more than 20 years ago. The other was Mr. Zeng Qingcun. In 1990, he proposed the "natural control theory", which means that our human beings need to achieve a balance between man and nature by restricting their behavior. How to restrain? Mr. Zeng gave methodology. From this perspective, humans must adapt to their behavior to reach a balance between nature. This requires the continuous efforts of our scientific community.
Calculation method of carbon emissions
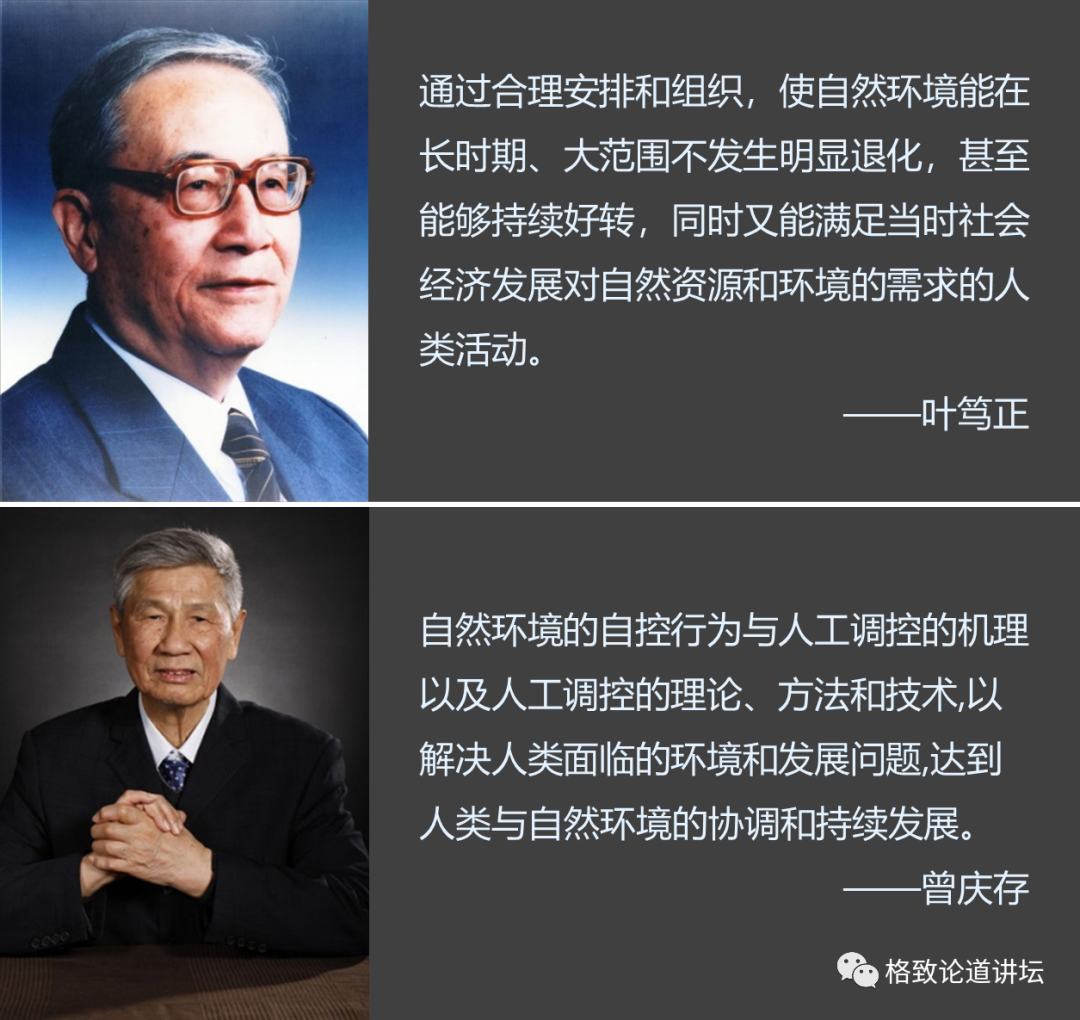
Completed: 20%////////// The end (emission) of global carbon generation to the consumer side (absorption) is actually the result of different ages. From the perspective of emissions, fossil fuels basically account for more than 80%; and 14%are land use, such as switching from forests to farmland. There are two major pieces of the absorption end, one is the ocean, and the other is a terrestrial ecosystem. These two parts "eat" about 50%of human carbon emissions.
From 2010 to 2019, global carbon revenue and expenditure (GCP, 2020)

Then there are about 46%of carbon retention in the atmosphere, and our scientific community hopes to reduce this part. But the premise of falling is to conduct observation and evaluation. You have to quantitatively calculate which part of this part of this part of this part. Therefore, this involves the method definition of the method of calculating carbon emissions in IPCC (the special committee of the United Nations Intergovernmental Climate Change) -the list method, which is simply the bottom -up method.
Left: From the bottom up

Right: From top to bottom
As shown in the left figure, we can count how much coal and electricity consumed each factory, which accurately calculates the emissions of carbon dioxide; it can also calculate the carbon absorption through the growth of the tree. In a small area, this number can be calculated very accurately. However, everyone can imagine that if the trees in Beijing are included, the possibility of measurement is very small, and the global scope will naturally be very difficult.
The other is a top -down method to share with you today. How do we use rapid development satellite technology to assist or supplement the bottom -up list method. We know that the low -orbital satellite is 1 round of the earth for one hundred minutes, and there are 15 to 16 laps a day; and its detector is unique and can be observed for several consecutive years. Therefore, the advantages of global coverage, uniform one, uncertainty can be calculated. As a result, complementarity and verification can be formed from top to bottom.
From the perspective of the needs of carbon monitoring and evaluation, from the provincial, municipal, hotspots to a carbon assessment of an industrial area, the assessment of China's carbon exchange capacity, including my country's carbon exchange capacity, needs to be resolved from the whole.
On the other hand, from the perspective of IPCC methods, we must limit the heating of the earth to the range of 2 degrees, but the human earth is so large and the space for carbon emissions is so much. How can we allocate countries? It involves the contribution of emission reduction, investment in funds, and carbon exchange. Here is a concept called global inventory. It is a game of the world, and the core method of inventory is satellite monitoring. So this is a high -tech issue.
Scientific research
As mentioned earlier, from the perspective of method science, carbon flux is highly coupled with climate change, ocean, and atmospheric ecosystems, so how to decoup is facing very large scientific issues.
These three aspects have put forward demand for global carbon monitoring, especially satellite monitoring, so in the revised version of IPCC2019, the standard of "verification of the auxiliary list with atmosphere" is proposed. The actual method was proposed at the Paris Climate Conference in 2015 that it was an effective means to measure the national dermined Contribution.
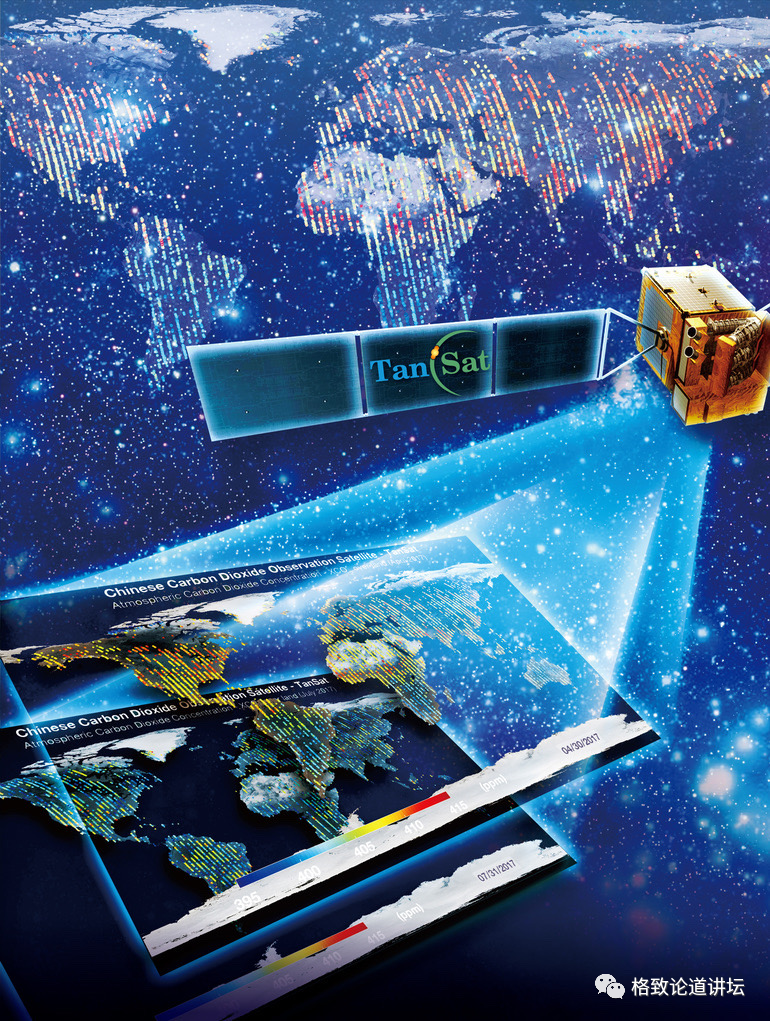
Tansat: China's first carbon satellite
Completed: 40%///////////
Europe, the United States, and Japan are actively joining the action, and we are not far behind China.
Left: Japanese greenhouse gas observation satellite (GOSAT)
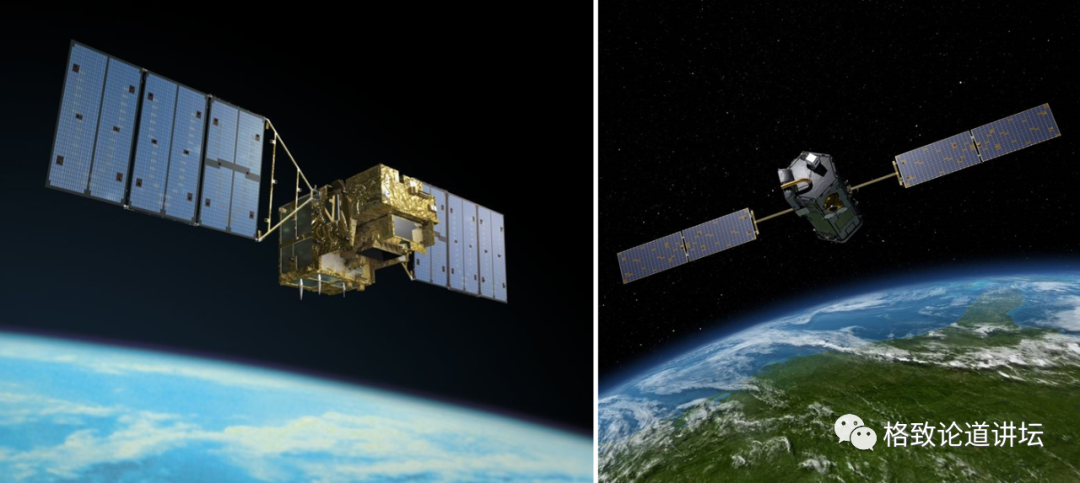
Right: US Rail Carbon Observer No. 2 (OCO-2)
The satellite on the left is the Gosat launched in 2009. As mentioned earlier, it developed from Japan's first test satellite in 1996. This satellite is very successful and has been observed for 12 years. The application part will be mentioned in China carbon exchange and global methane emissions, and the data used is mainly based on this satellite.
The one on the right is OCO-2, which is a satellite launched in the United States in 2014. Why is it called "2"? Because it is the second satellite of the series. In the US -Japan competition, the first satellite (OCO) and GOSAT were launched around 2009, but the launch failed.
Chinese carbon satellite (TANSAT)
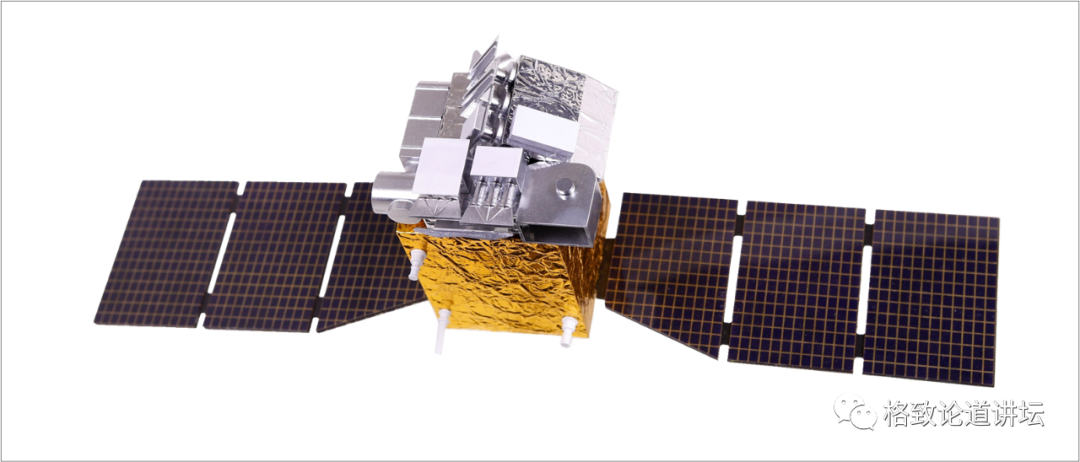
my country also highly supports the development of satellite business. Around 2010, the Ministry of Science and Technology followed the progress of Japan -US satellites in a timely manner, conducted more than a year of demonstration. In 2011, it started China's first carbon satellite, Tansat, and launched at the end of 2016. Our team is very lucky. The process of participating in the design, development, launch, and data application of this satellite is observed to observe the concentration of carbon dioxide and calculate the volume. Today we will focus on sharing with you.
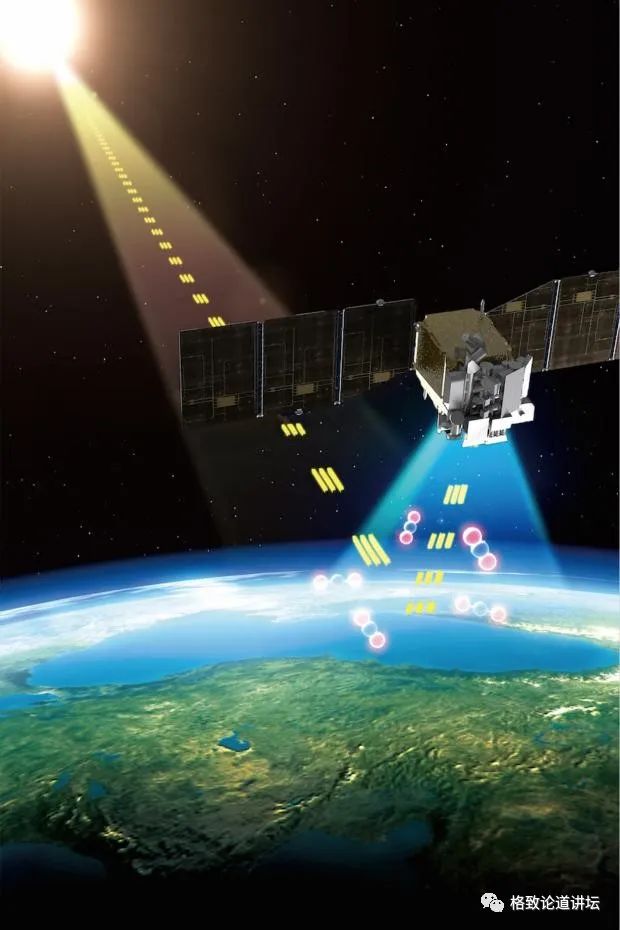
The satellite mainly has these goals: the first is "see clear", and its meaning is to identify carbon dioxide from a variety of atmospheric components. We know that satellites can not only monitor carbon dioxide in the atmosphere, but also monitor other substances, such as PM2.5, ozone, cloud, gas -soluble, PM2.5, etc. How can we accurately recover the corresponding information? After the sunlight passes through the atmosphere, carbon dioxide will leave the absorbed information, which can be seen clearly. The second is to "see", and the third one must be "see". "All" has two directions. One is the long period of viewing, and the other is to increase the coverage of satellite observation as much as possible.
Where is the biggest difficulty of carbon dioxide monitoring? Since carbon dioxide is an inertia or relatively stable gas, from the ground to the top 20 kilometers, its concentration distribution is almost more than 400 PPM (one -million -million), so the concentration of a whole column observes the concentration of the satellite. The source of carbon dioxide (emissions and absorption) is on the ground, so the ground changes very much, but on average to the column, this change is relatively small, which is about 2%. In this case, we put forward 1-2 PPM requirements for the monitoring accuracy of satellites. Compared with the current 410 PPM conditions, 0.5%accuracy, this is a very big challenge. Up: Observation spectrum
Below: Simulation spectrum

In order to overcome this challenge, we put forward extremely high requirements for satellite's spanning capabilities. This picture explains from the perspective of satellite. The spectrals we actually observe have three segments, each of which represents a channel of satellites. Note, what is the width of the channel? 30 to 40 nanometers. Everyone can imagine that this is a very, very small range, and there are very delicate information absorbed by carbon dioxide. If I want to capture the absorption information, the spectral resolution is about 0.15 nanometers, so this is a huge challenge for engineering and science.
At the same time, we observe the strong absorption and weak absorption band of carbon dioxide at the same time, and then after counter -discrimination calculation, we can obtain a concentration of a column. This concentration can be verified by global standards.
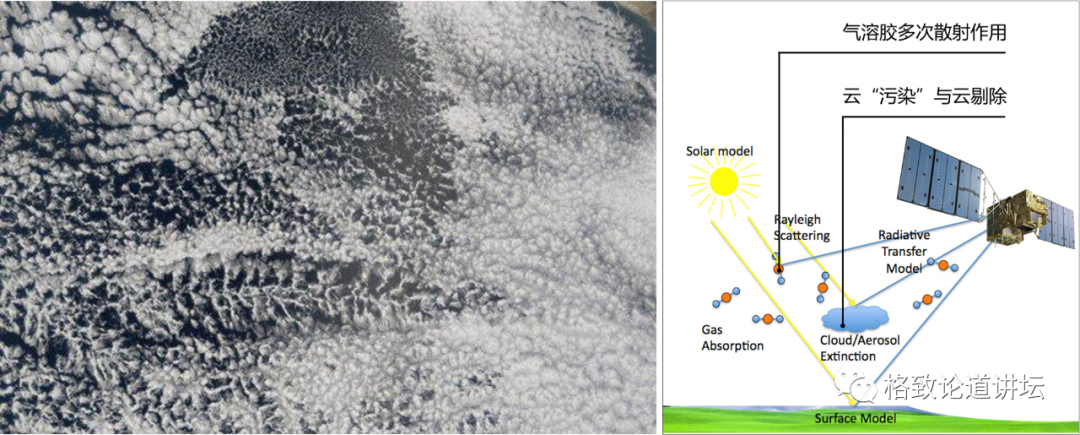
What should I do with the concentration next? Calculate the discharge flux. It is also a major challenge to eliminate the impact of cloud and gas solution highly.
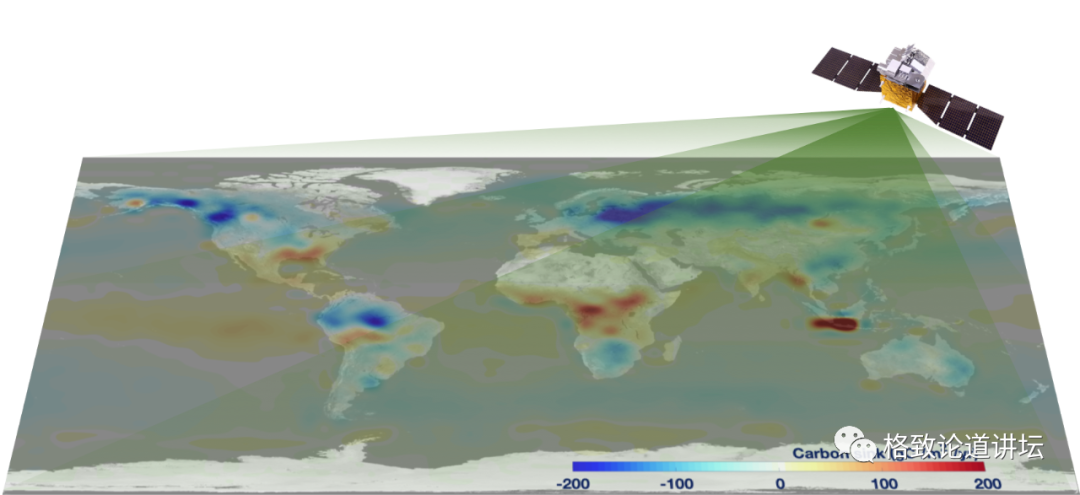
How to calculate the source exchange through concentration? This picture is a schematic diagram of African fire. Everyone can see that the smoke is scattered globally because of the fire formed by the fire. We can accurately observe and calculate the concentration through the advantages of global observation of satellites.
Calculation method of the atmosphere of carbon source exchange
The change of concentration is equal to the atmospheric conveying process plus source exchange. After we calculate the atmospheric transportation process with accurate conveying models, the rest can indirectly introduce changes in source exchange.

The change of this source is not only an ecosystem, but also artificially discharged. As long as I have enough concentration observation data, I can use a unified method to perform an ecosystem absorption, urban human discharge, ocean absorption, and so on. So this is a huge method of methodology.
Autonomous research and development
Because our team has received the support of the Ministry of Science and Technology and the Sciences' Carbon Priority, after ten years of development, a set of simulation anti -discrimination system called IAPCAS has been established. Within half a year of the launch of China's carbon satellite, it took out the first version of the data. In November 2017, we also participated in the international conference of the International Land Observatory (GEO) International Conference for data sharing, forming a very good impact internationally. This includes our treatment of gas solution and rolling clouds, and some technologies break through a high concentration monitoring.
The United States, Japan and China have carbon monitoring capabilities. How can the satellites reach a certain accuracy? There is a recognized verification data in the world, with an observation network and database. We took out our satellite data. After comparison, our accuracy reached 1.47, which is at the same level as GOSAT and OCO-2 in the same period.
Discovery my country's underestimated carbon exchange capacity
Completed: 60%///////////
Coupled with the source calculation method mentioned earlier, we can use carbon satellite monitoring to China. Next, let me introduce to you how to insight into this change.
Thompson et al., Nature Communication (2016)
The picture is: the National Institute of Environment, France, French Climate and Environmental Science Laboratory, the University of Wakhunagan, the Dutch, the Japanese Ocean Earth Science and Technology Agency, the Australian Federal Science and Industry Research Organization, the Japanese Meteorological Agency, the Russian Central High Meteorological Observatory Calculation result
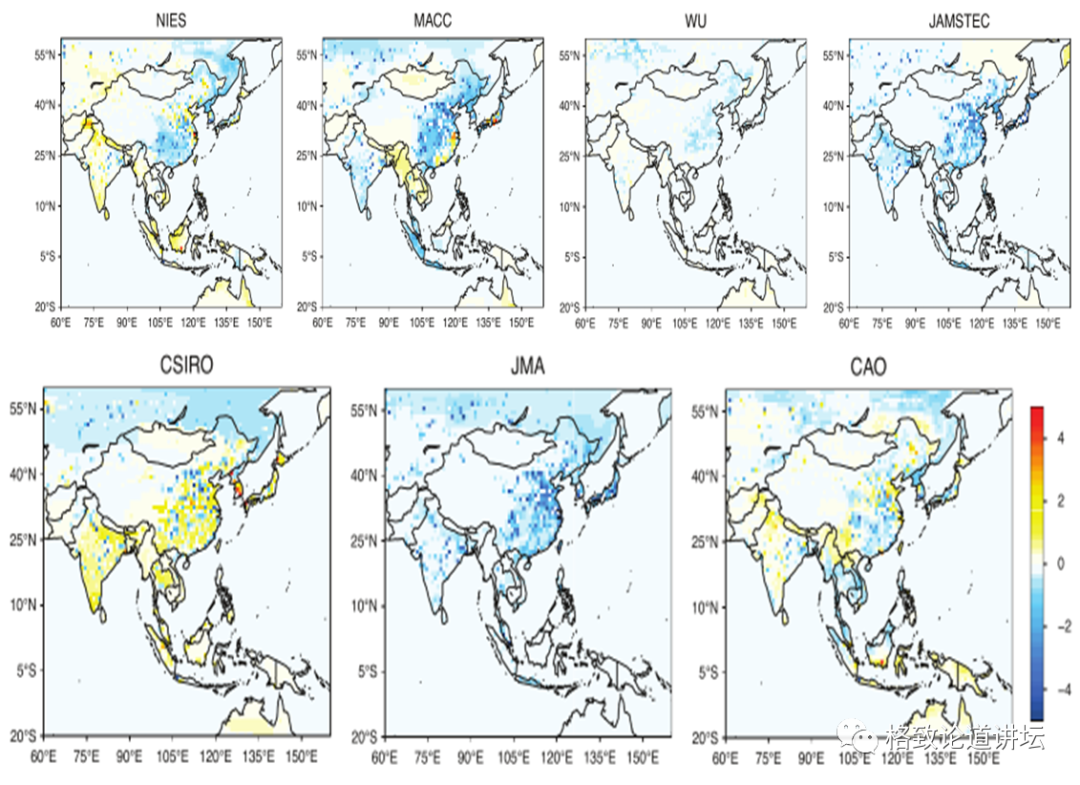
Regarding the ecosystem, Academician Park Shilong gave a very good way to pave the way (China's land ecosystem, how much can you absorb carbon dioxide? | Academician Park Shilong). The bottom -up method also has a better calculation result. Everyone watched the seven pictures on the 2016 "Nature Communication", and they presented the carbon exchange calculation of seven international teams to East Asia. The settlement results ranged from 1.1 to 1.1 billion tons. This change range is very large, and it also shows that there is still a lot of room for improvement in calculation methods from top to bottom.
For this huge range of changes, how should we play the role of satellites to combine the results of ground observation? The following picture gives the answer.
Carbon exchange distribution of Chinese land ecosystems
We use the international model method to increase ground observation data, including data from 6 ground stations in the Meteorological Bureau, as well as data from Hong Kong and Siberia, to make this pair of carbon exchange maps of Chinese land ecosystems. The blue in the figure represents the intensity of carbon exchange; red means the strength of the carbon source. Everyone looks at this picture in the lower right corner: It shows that there is a huge carbon exchange in the southwestern region of our China. Everyone knows that we have a great contribution of our country with great afforestation. Especially in the Southwest region, there are many fast -growing eucalyptus trees. They are harvested in a short period of time as wood exports. However, in the bottom -up method, it may be underestimated in 5 years or 10 years. The space distribution is consistent, and the strong carbon exchange distribution is wider
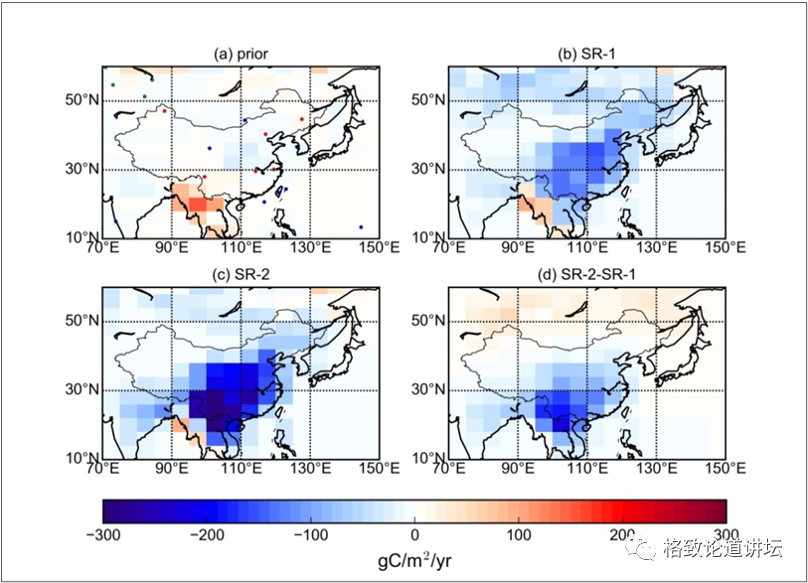
We have used OCO-2 introduced earlier. It has 3-4 years of data and GOSAT has 10 years of data. We enter the satellite data into the system. Figure C is the result of the ground concentration. According to the satellites in Japan and the United States, regardless of the spatial distribution, seasonal changes, or the final value, it proves that China does have a relatively underestimated land ecosystem carbon exchange.
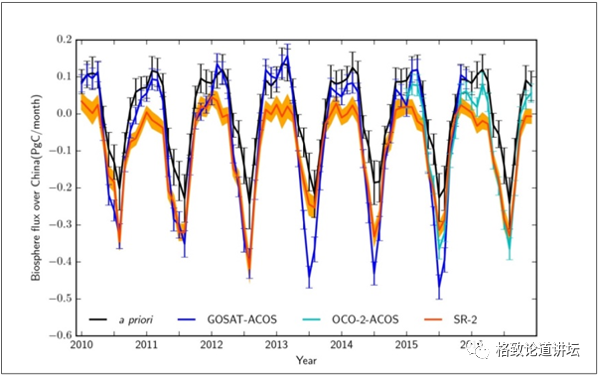
Seasonal changes are the same, and summer carbon exchange is stronger

Everyone noticed that the sharp corner of the blue line on this picture means that the summer satellite observes a stronger absorption, indicating that the carbon exchange in China should be greater.
This indirectly proves that our Chinese ecosystem has a relatively large carbon potential in the past 10 years.
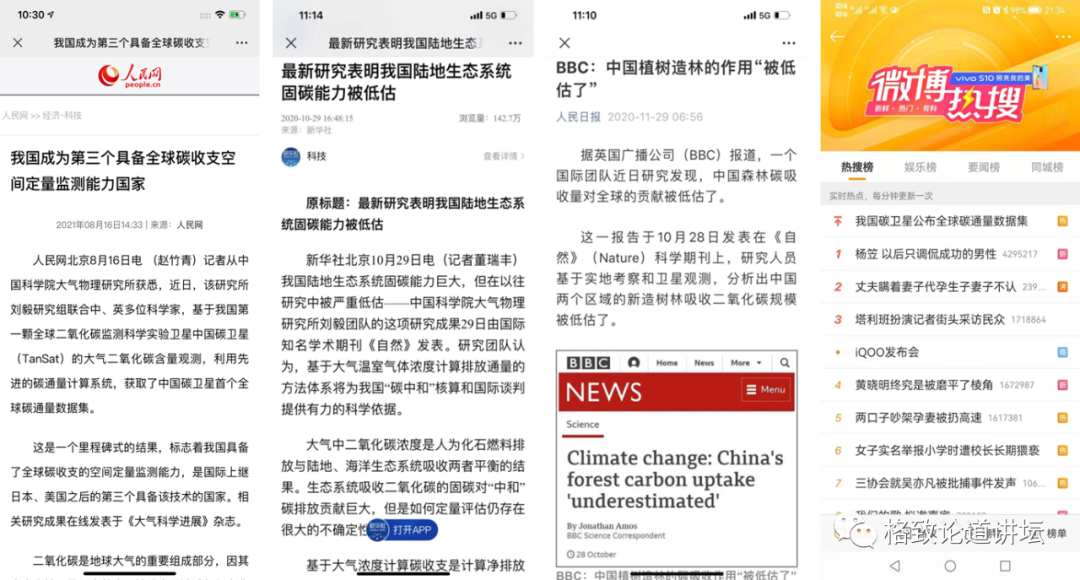
After the release of "Nature", this achievement also caused a very strong response from CCTV and other media. "Global carbon mounting of carbon satellites in my country" has also entered the hot search list. It shows that the carbon satellite has received very high attention.
Methane, a new direction of future satellite monitoring
Completed: 70%///////////
What will we do in the future? Taking the hot methane recently as an example.
Why is methane "hot"? It has a main characteristic -a life span is 1/10 of carbon dioxide, but at a century -old scale, the effectiveness of methane generated is 28 times that of carbon dioxide. If you consider 10 or 20 years, it is dozens of times of carbon dioxide. Why? Because its life span is relatively short, the concentration is lower than the carbon dioxide concentration. Methane is about 1 PPM, and carbon dioxide should now be more than 400 PPM.
After the United States returned to the climate stage, the first hot spot caught was methane? When the presidential climate was specially visited, he proposed to "monitor" Chinese emissions with satellites. At the Glasgow Climate Conference in September 2021, the United States and the European Union jointly launched a methane reduction operation. More than 90 countries participated in it and planned to reduce emissions by 30%by 2030. We have not participated in China. However, after the meeting, China and the United States reached a joint declaration of strengthening climate action to promise to solve the problem of methane emissions.
Global and China and the United States methane emissions
Why didn't China participate in the "Global methane commitment"? Let's take a look at the source of methane. From 2008 to 2017, in these 10 years, Chinese methane people were emitted 90%of China's total emissions, and Americans accounted for 60%of emissions. Through the bar chart on the right, you can see the highest column close to 50%of human emissions, which is a methane leaked during the mining process. In addition, more than 20%come from our cattle and sheep livestock, and 18%are rice production. Therefore, the three parts with the most proportion are closely related to our daily life.
This number came out, but it was not allowed. Our Chinese scientists must come up with their own voice. So satellite monitoring will play a very important role in this process. But in methane, the United States came ahead. How can we use its data to analyze which part of China has produced more methane and which part produces less? So this is another strategic needs that a country urgently need, and scientists who are satellite have made very big challenges.

Let me share with you how the satellites work.
2010-2019 Global methane emissions distribution
Source: feng et al., 2022. nat. Commun.
We published an article with the British team on March 16, which was included in "Nature · Communication". The picture on the left has given the global methane emissions distribution in 10 years. Everyone see that 60%of the green parts are low latitude, which means that low -weine tropical areas are the main sources of methane.

The data of our article comes from GOSAT, including the data of methane, the temperature of the sea surface, as well as precipitation and soil humidity, which are made by satellites. Therefore, satellites can be observed very well at the global scale.
The effect of sea temperature and precipitation on methane emissions in tropical areas
Source: feng et al., 2022. nat. Commun.
The above picture illustrates what factors in South America and Africa are related to: Different lines represent that the change of methane is related to temperature and precipitation height.

Finally, we summarized the changes in global methane growth in 10 years: 80%came from tropical, that is, a large part of methane comes from nature. Therefore, the satellite digs out the laws hidden behind the change very directly, which is very important.
GHGSAT resolution is 50 meters, 12 kilometers width width
D. J. Varon et al., In addition, Canadian private companies also launched methane monitoring satellites. Everyone looks at the yellow area and monitors methane emissions of a coal mine in Inner Mongolia in Inner Mongolia with GHGSAT satellites. The value we reported was 170, and the satellite was estimated to be 2400, so this was ten times worse.
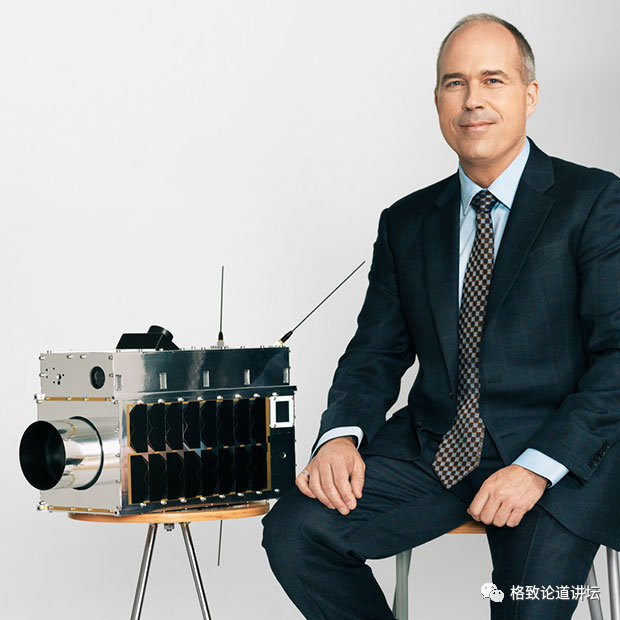
This satellite was already in heaven seven or eight years ago, and it is even smaller than that of people. This small satellite will also play a very important role, so your emissions are transparent under some conditions.

In the future, the development direction of greenhouse gas monitoring satellites
Completed: 90%///////////
The United States is also developing another satellite. We call this satellite as a static satellite. The low -orbit satellite mentioned earlier is at a height of 700 kilometers and the static satellite is 30,000. It is synchronized with the earth. This forms a static static on the earth: I am over you. This is the same as our Fengyun 4 meteorological satellite.
As can be seen from the figure, it gives a very good coverage in a day of scanning. The two green tracks are OCO-2 observations 8 days apart.
Europe's next-generation greenhouse gas monitoring satellite-CO2M Plan
The United States has developed the world's first high -orbit static satellite, and Europe is also layout, layout of three satellites. Its width is two or three hundred kilometers, forming a very good monitoring ability.
What about China? The Ministry of Science and Technology has given priority to the development of the next generation of Chinese satellites, and we have undertaken the design and computing work in satellite development. Our preliminary idea is that the next generation of satellites should have a long life, have a certain alternative ability, have network monitoring capabilities, and have a certain cost -effectiveness.

This is the preliminary map of China's next generation of satellites. We hope it can have the ability to monitor urban monitoring, regional background monitoring, and global monitoring.

Through the previous ten years of work, we have revealed the important role of satellites in monitoring carbon emissions, methane emissions, and ecosystem carbon absorption. It is hoped that at the next stage, in the face of very fierce international competition, our Chinese scientists can use collective wisdom to fully combine "from top to bottom" and "from bottom to top" to achieve our "double carbon" strategic goal.
thank you all!

- END -
The most technology!The freshman admission notice of Zhejiang University is made with Maogu
Recently, Zhejiang Agricultural and Forestry University announced the 2022 Most Sc...
found it?This is the candidate of the neutron, how did scientists discover it?
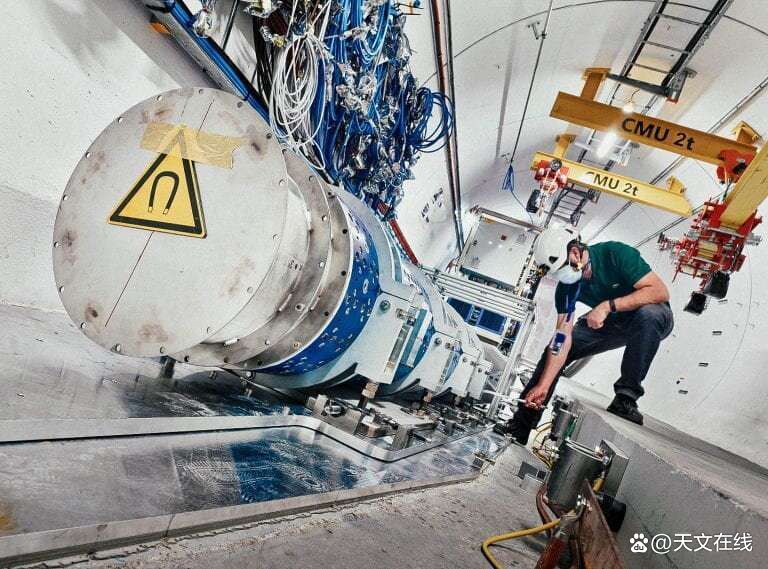
Middle microons, elusive, difficult to findMiracles generated by collisionsFASER p...