The use of 8 data perspective tables, take a look at it again, improve efficiency without working overtime
Author:Excel from zero to one Time:2022.08.19
I haven't shared the use of the perspective table with you for a long time. Today, I will share with you the use of 8 data perspective tables. Moving a demonstration, let you learn it, and quickly improve the efficiency of work. Bar!
Want to learn from zero, here ↓↓↓↓
1. Change the statistical method
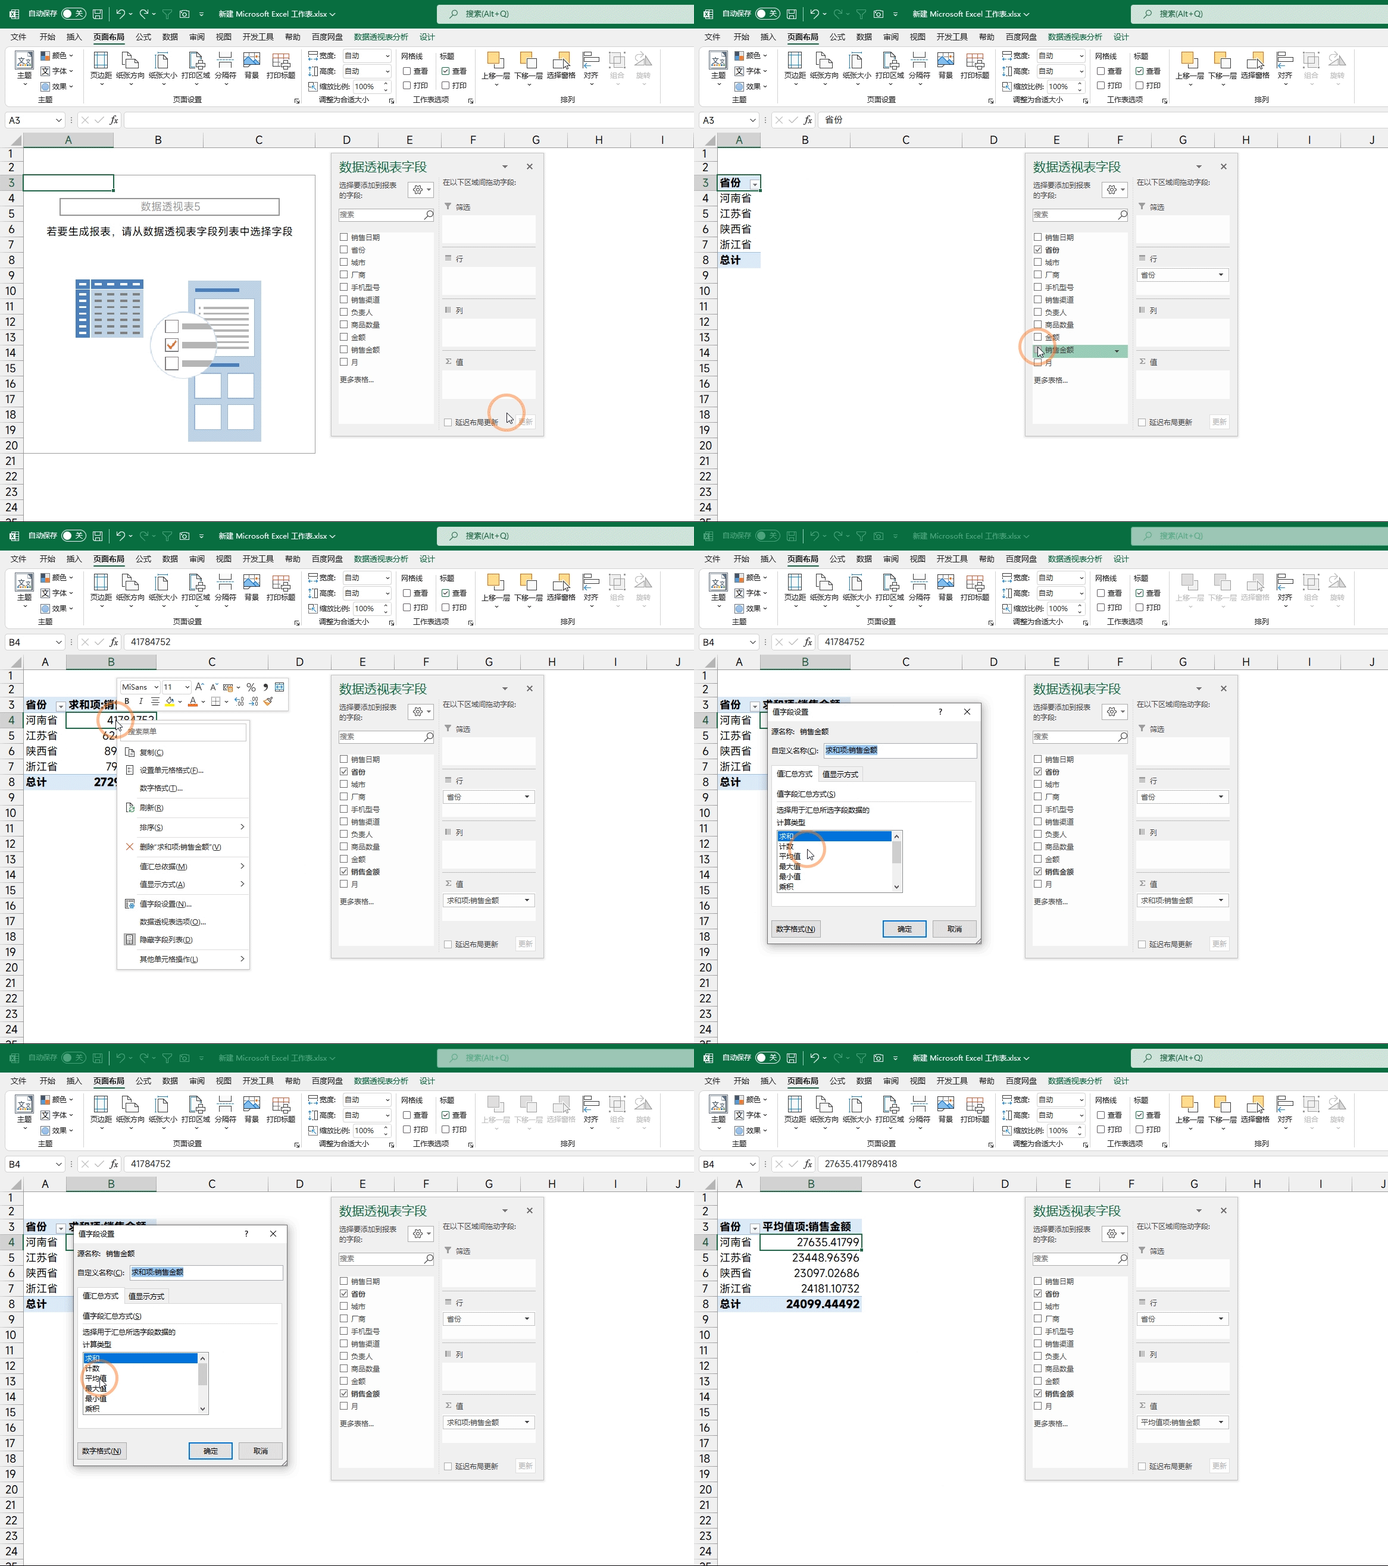
The perspective table will automatically calculate the data based on the data format of the field of the [Value] area. The value format defaults to [Seeking] Text Format default [Counting]
If you need to modify it, you only need to click the data of the [Value area] in the perspective table, then click the mouse right -click to find the [value field settings] to select the calculation method you need
2. According to the year, month, and quarterly statistics
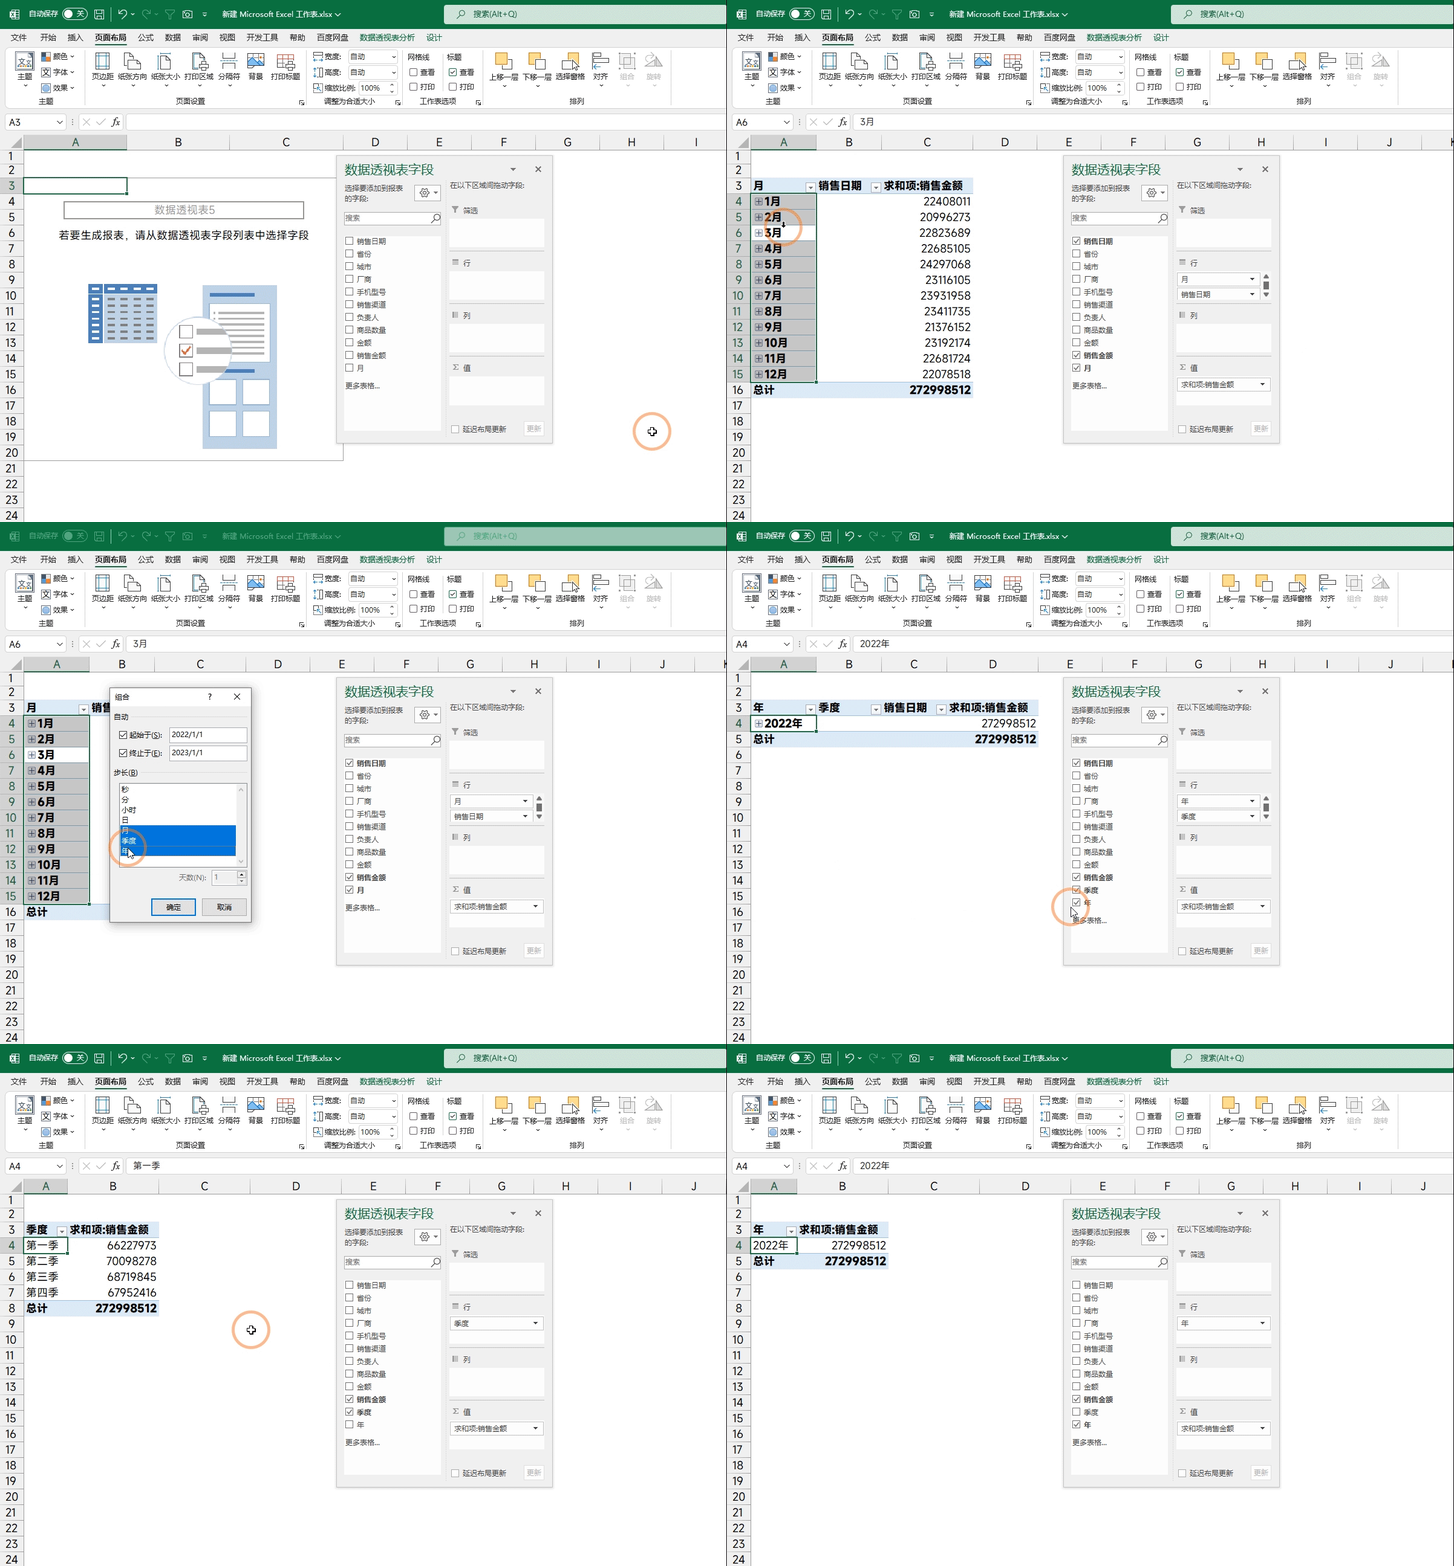
Generally, the data of the time format is placed in the [Line Area], and it will automatically combine the statistical method of [Month]. If you still need to carry out statistics of the year and quarterly, just click the data, then click the mouse to find [Combination to combine the combination ] Select the required date unit in it, and the specific time unit will be displayed in the [Field List]. Just place it as needed.
3. Cancellation of the Hui General Office and Total Bank
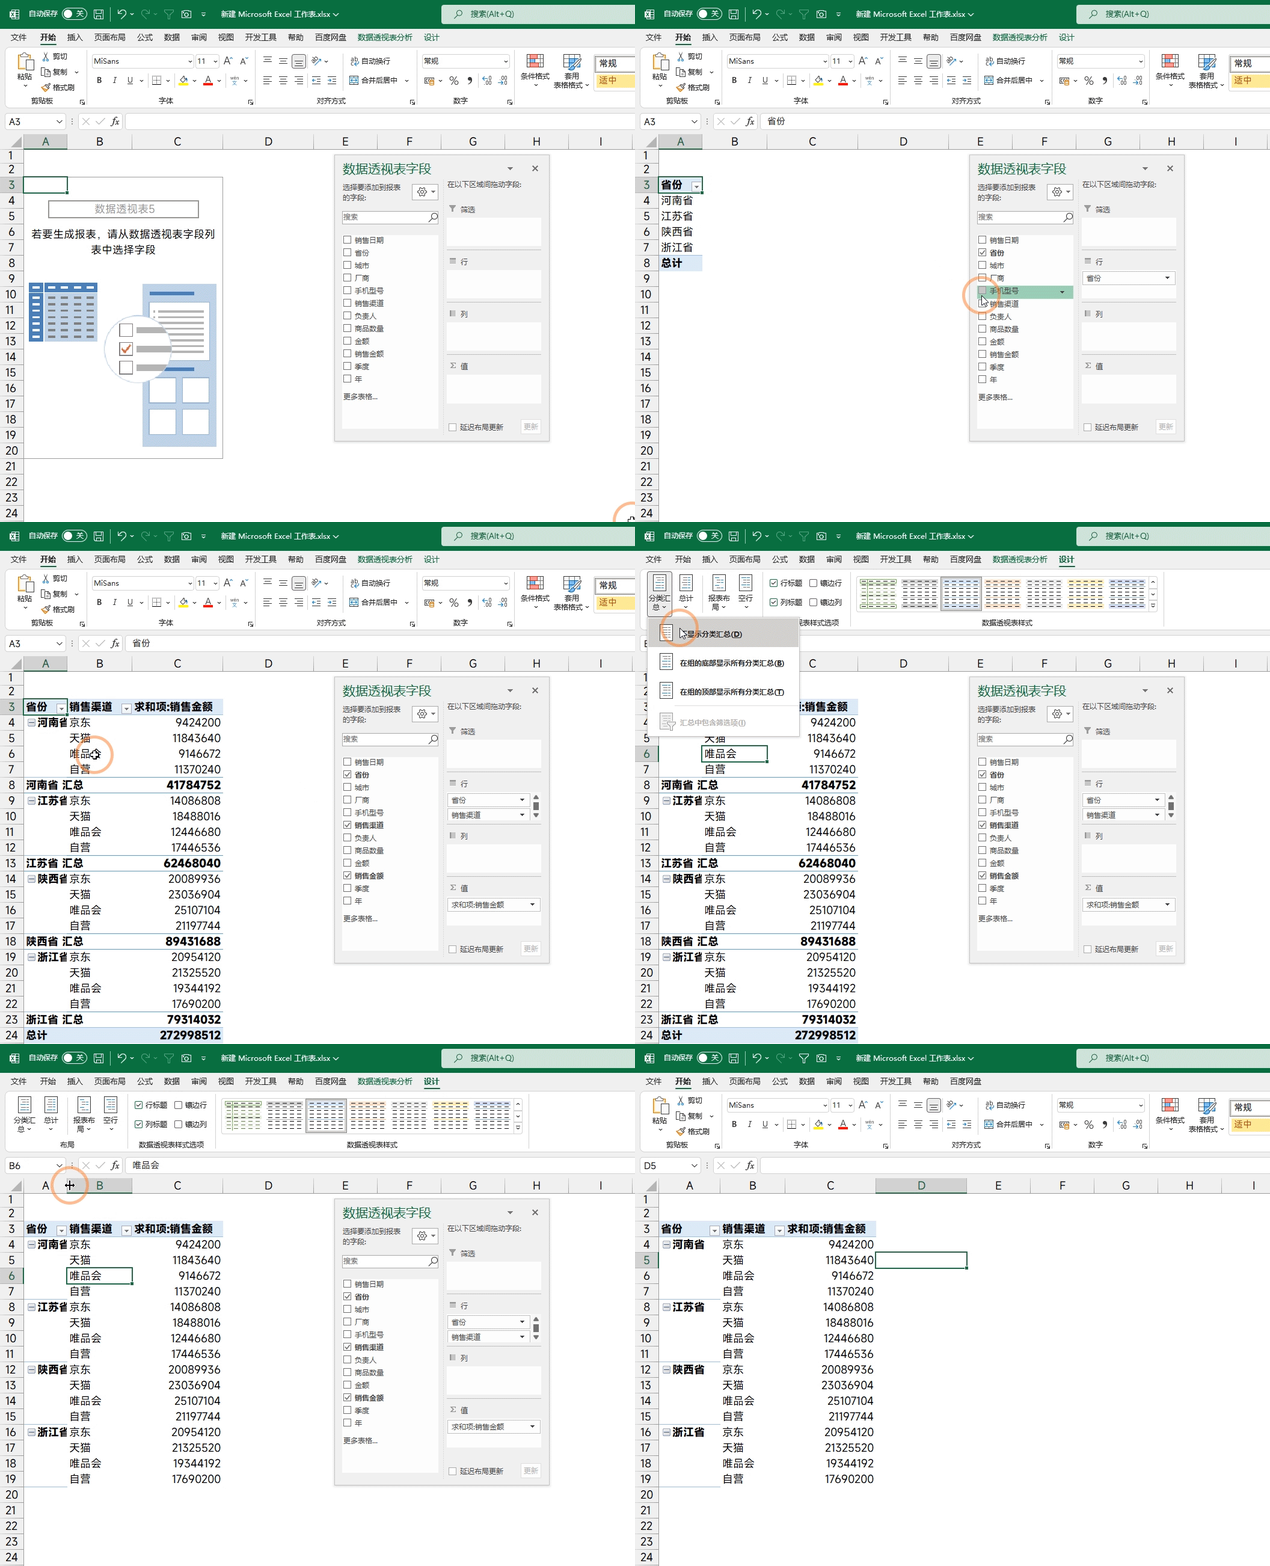
The summary bank and Total Bank are added by default. If you feel that the data reading is more affected, you can also cancel it. Just click the [Design] tab above
Click [Classification Summary] Select [No Display Classification Summary]
Click [Total] Select [Division and Listing]
Fourth, merger cell grid
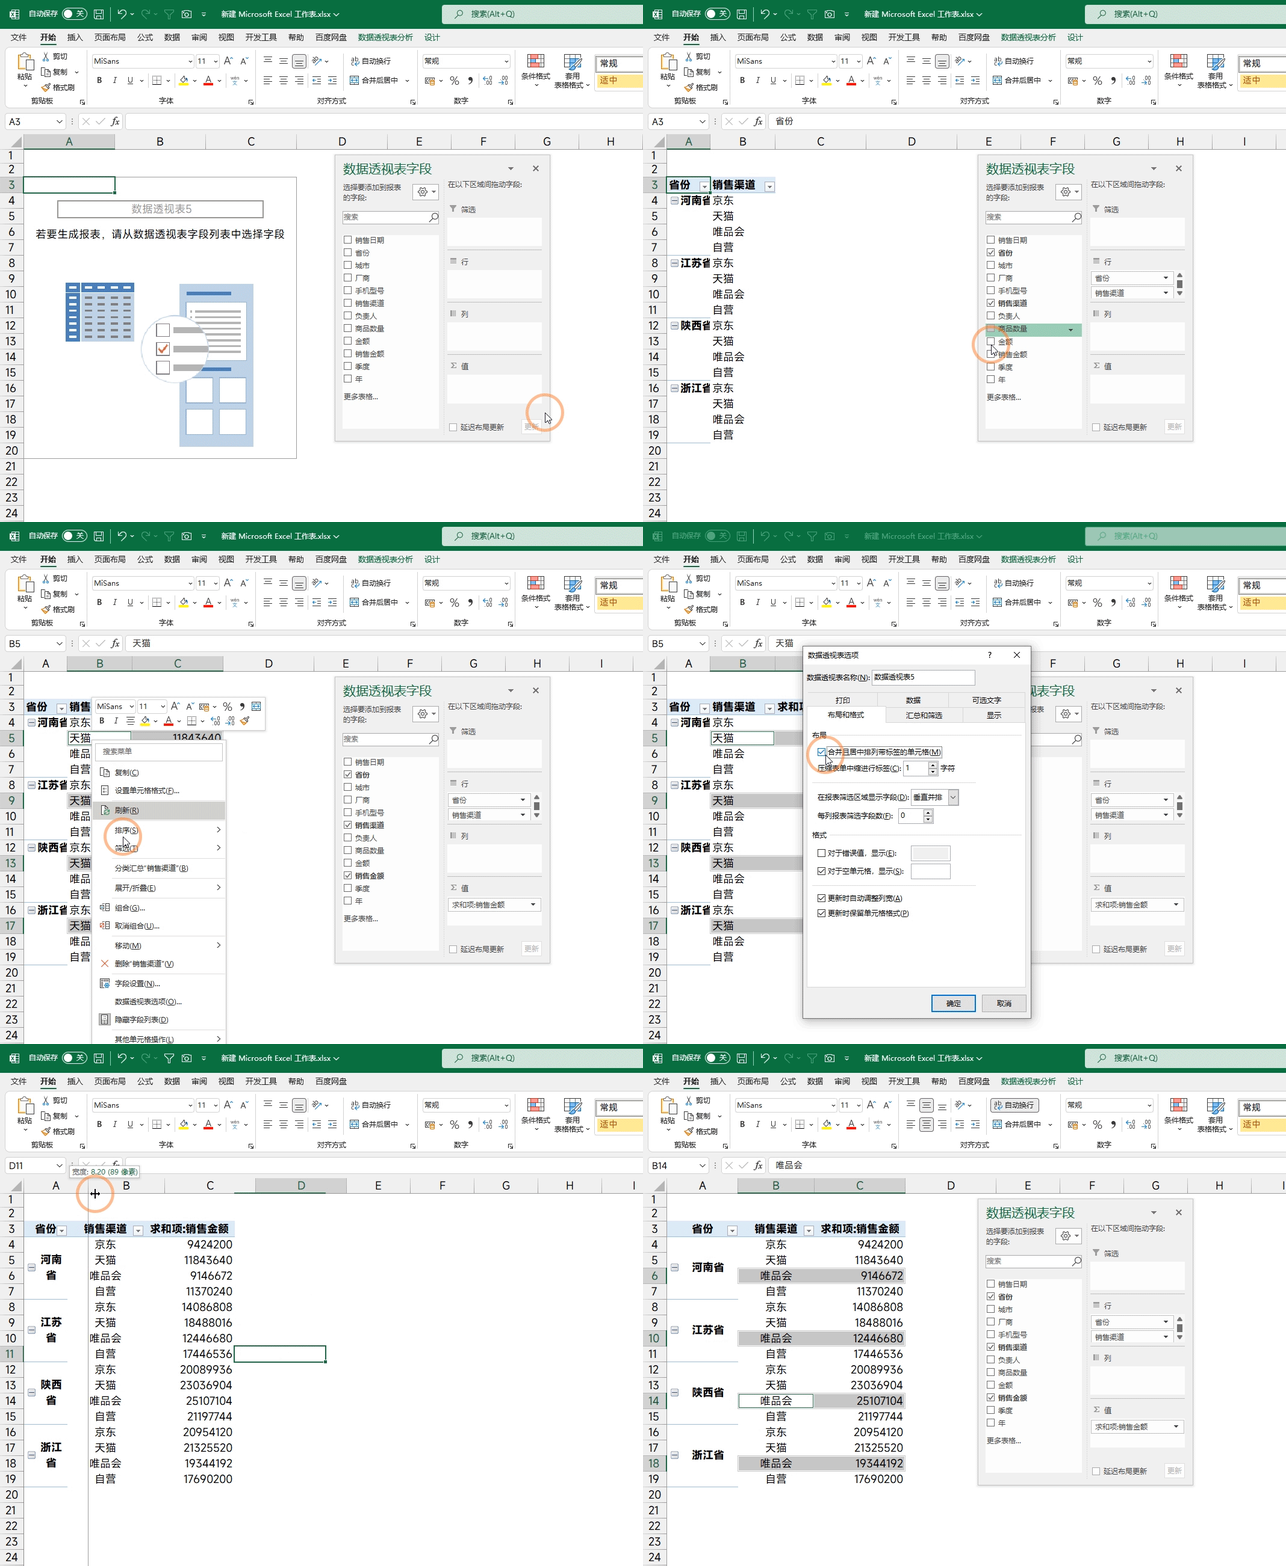
Click the first line of data, then click the mouse to right -click to find the [Data perspective table option] in [layout and format] to select [merged and centered and arranged tags in the center]
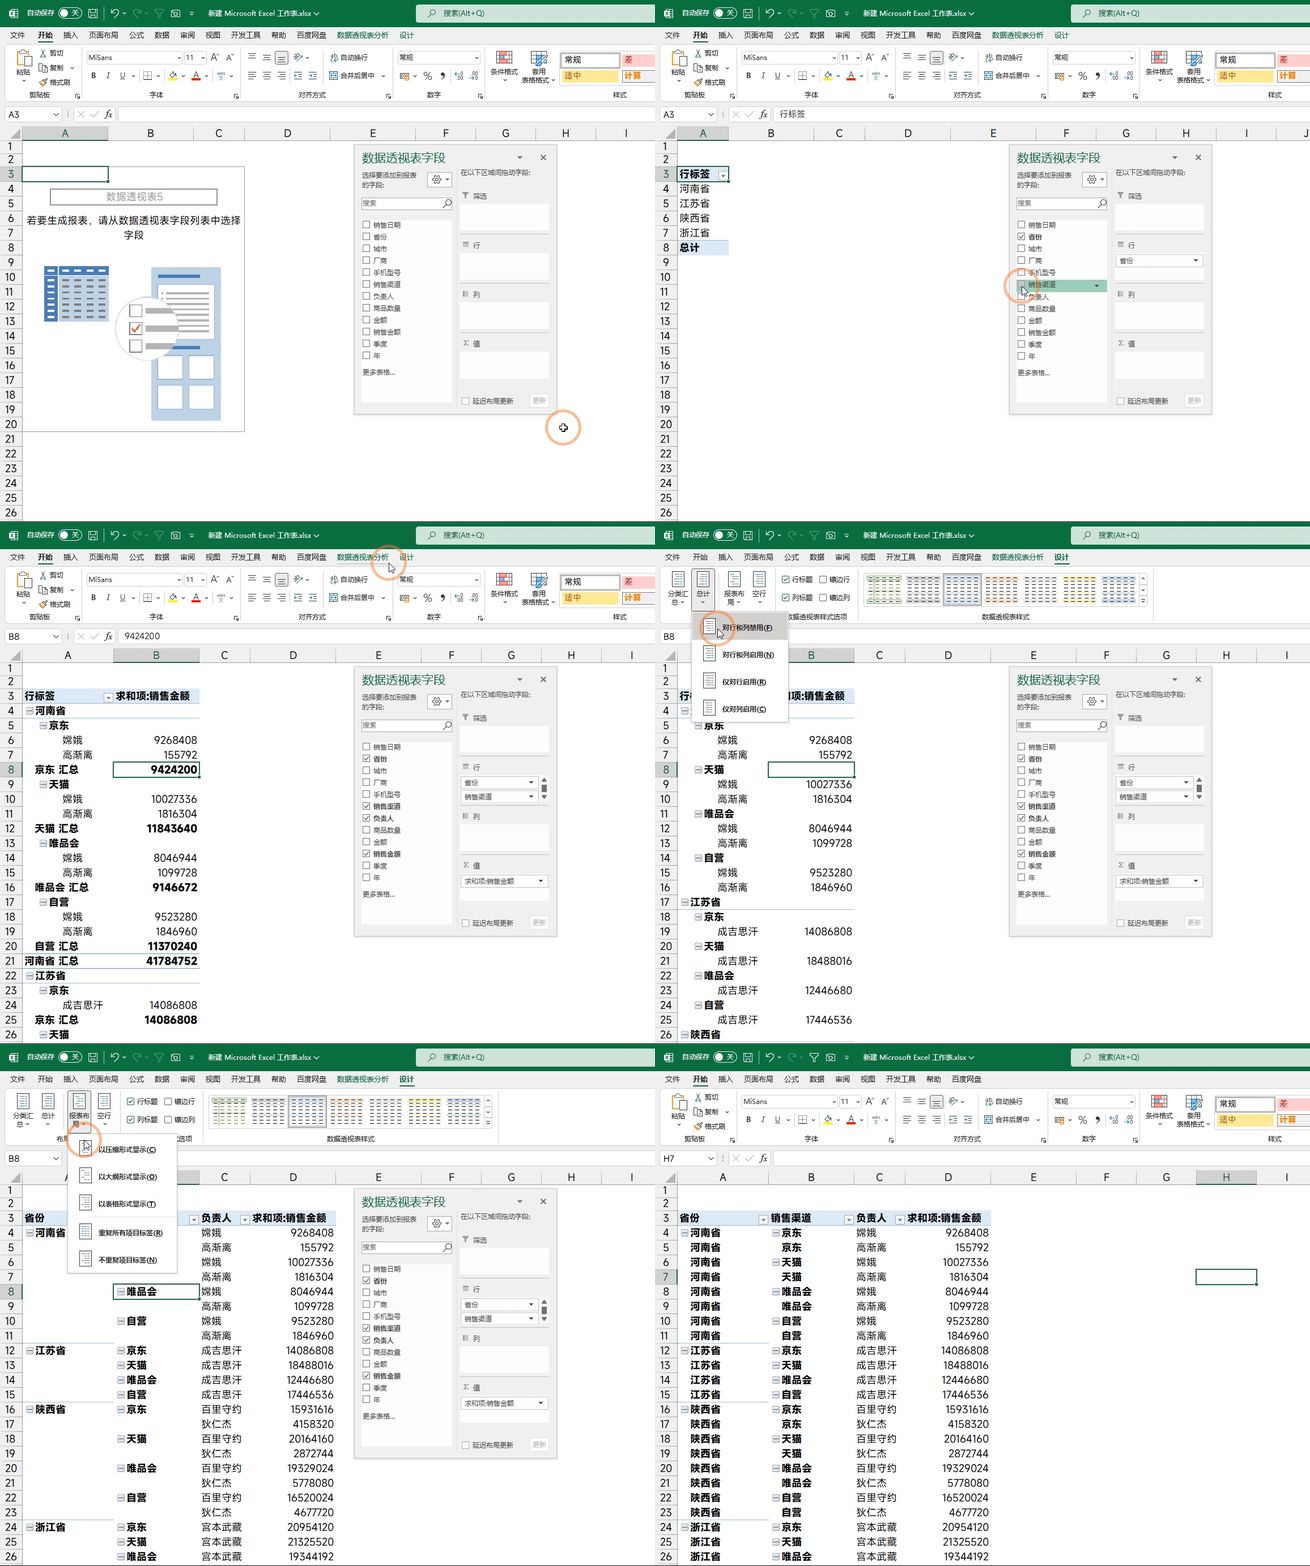
5. Display the perspective table in the form of a table
The perspective table default is [compressed display method] we can also change to normal display methods. It needs to be changed in the [Design] option
[Classification Summary] Set to [No Display Classification Summary]
[Total] Set to [Division and Banned in use]
[Report layout] Set to [Display in the form of a table]
Click [Report Layout] again to set to [Repeat all tags]
6. Do not enable GetpivotData reference
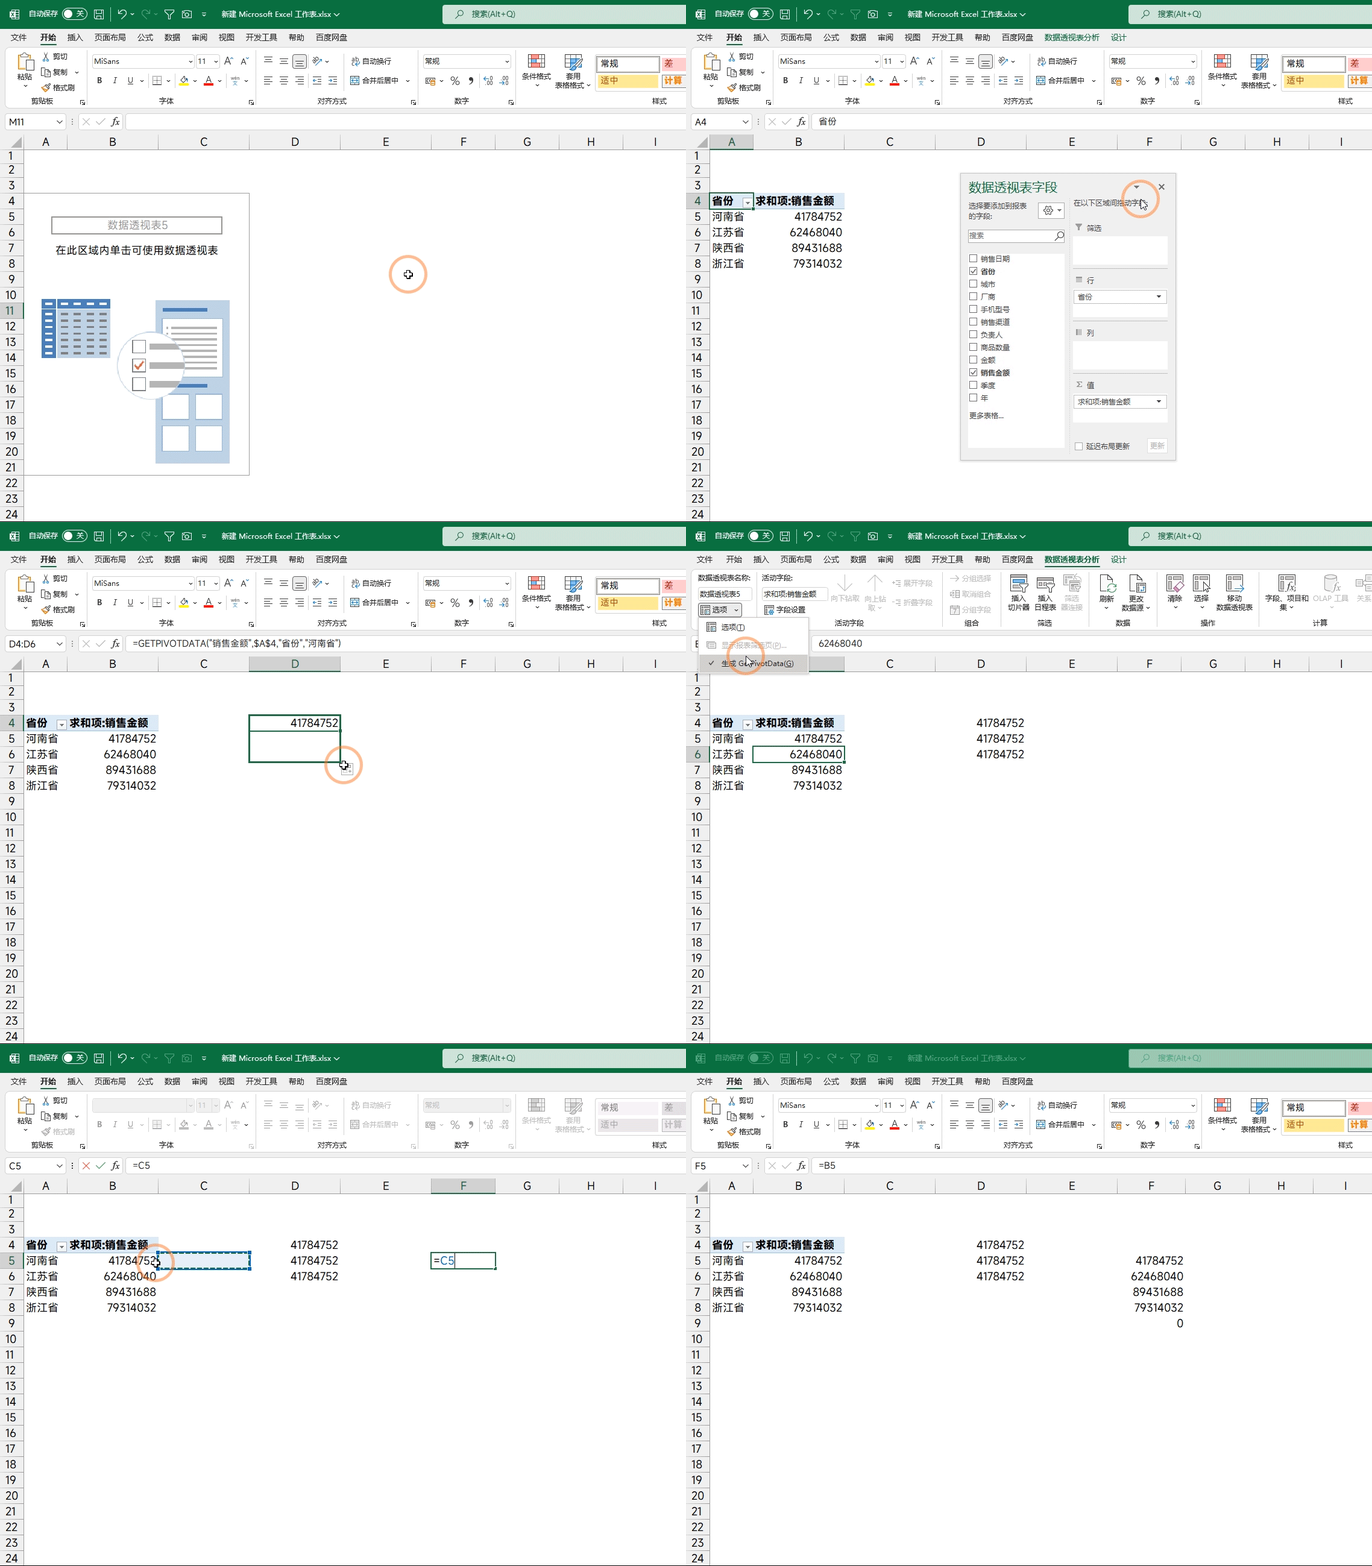
When we quote the value of the perspective table, the default method will be displayed as a reference method for getpivotdata. Many people do not understand this method of reference, and they cannot drag the formula. Cancel this reference method directly
Just click [perspective table analysis] to click [Options] on the left side to find [Getpivotdata] without choosing. In this case, it is a conventional reference method.
Seven, fast statistics proportion
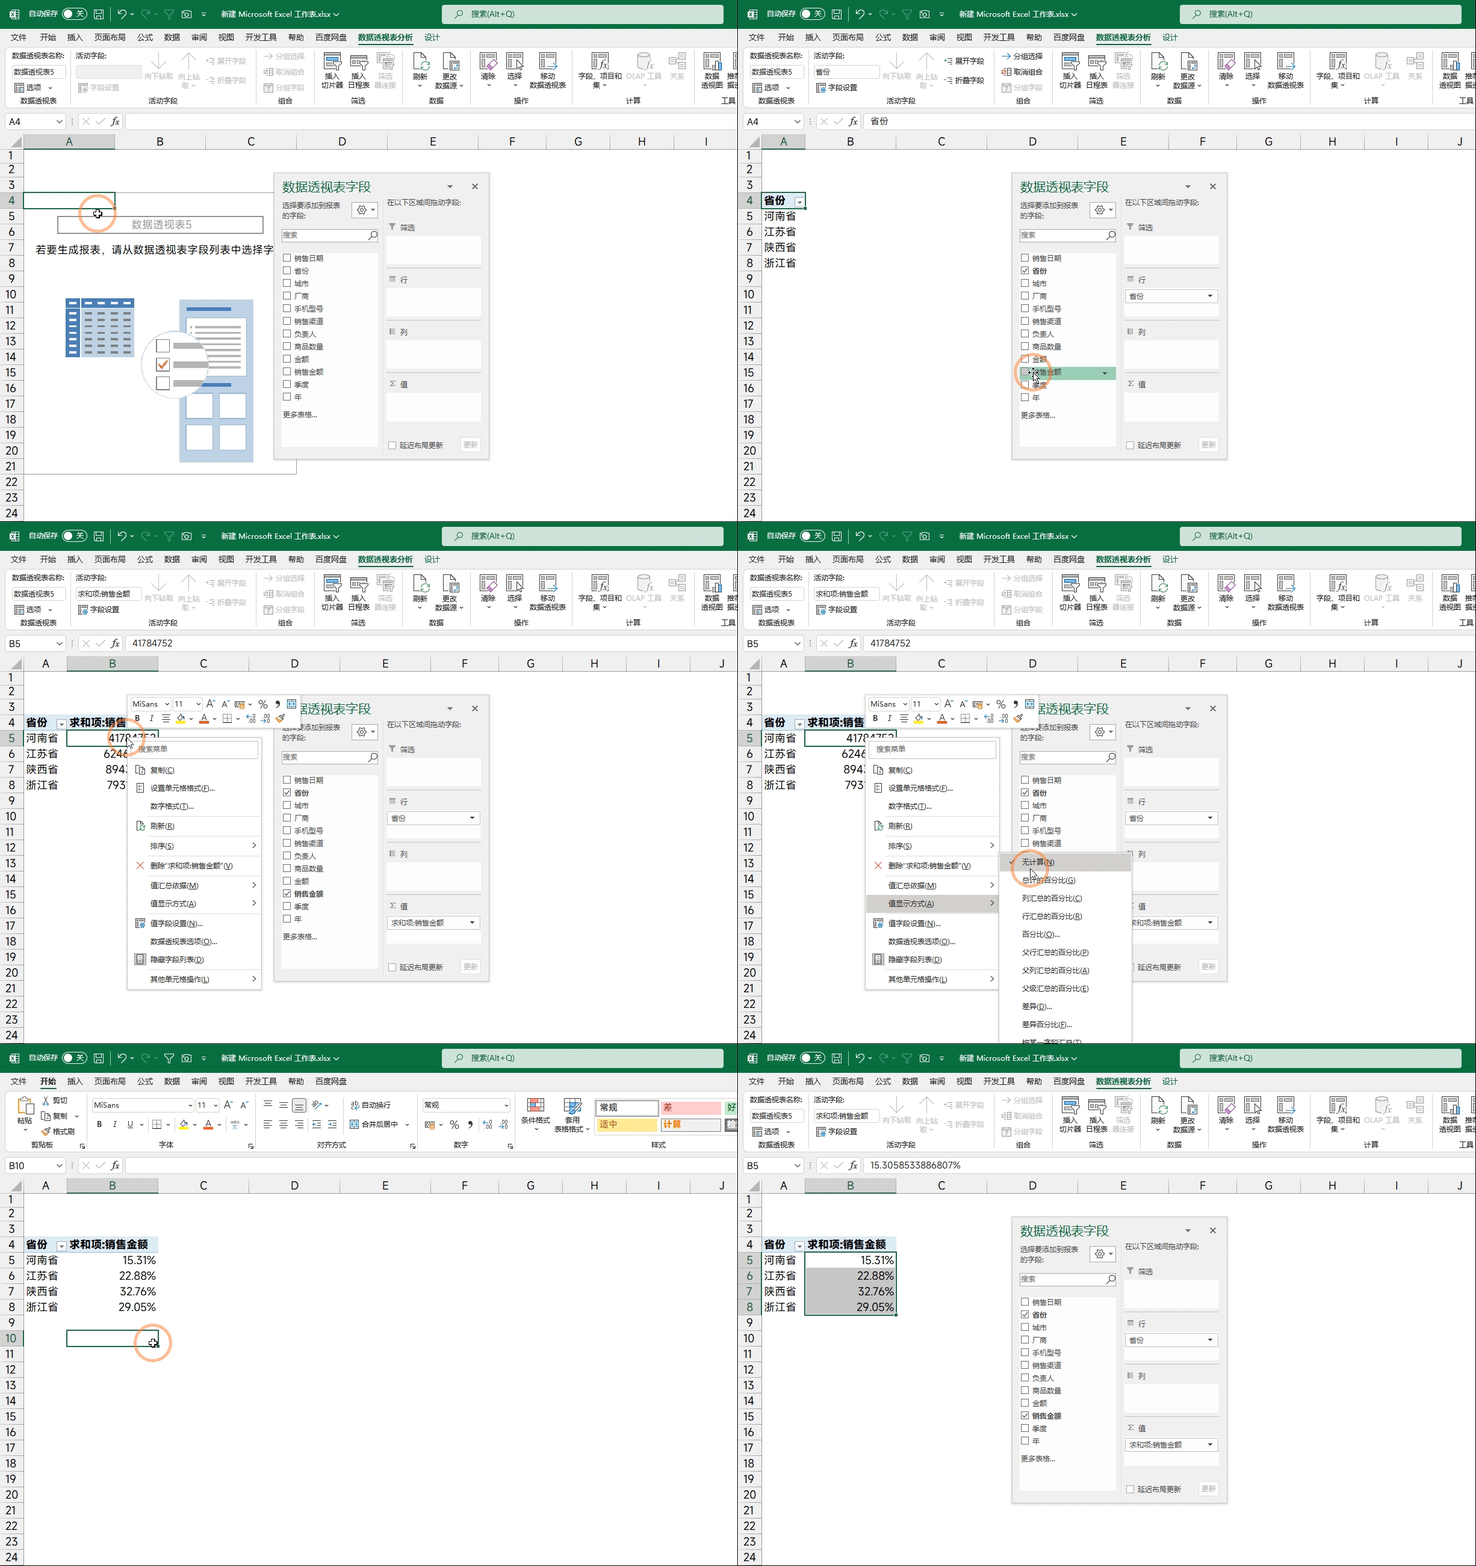
Just click the [Value Area] in the perspective table and right -click the mouse to find the [value display method] set to [total percentage]
8. Keep column width and format
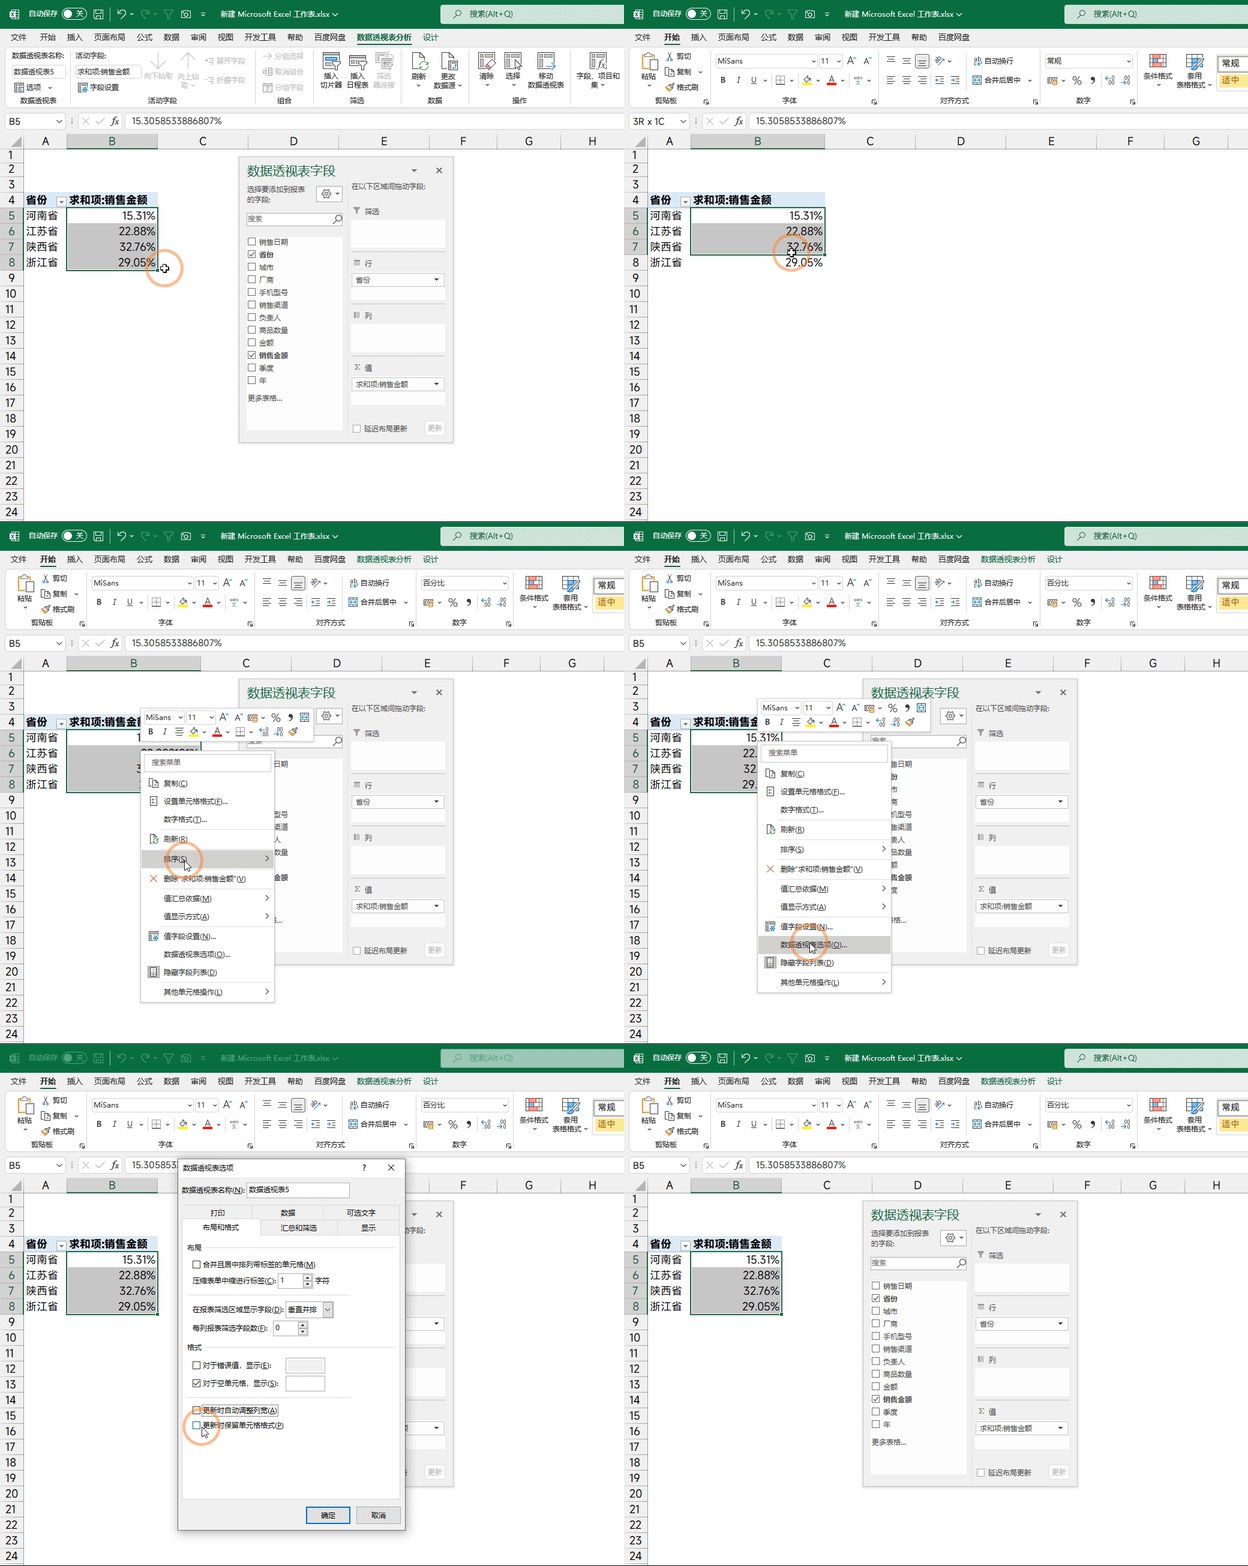
If we set [Format and column Width] in the [Value] area, when you refresh the data, they will restore the default column width and format. What should I do if the format is not changed?
You need to click the right mouse button to find the [data perspective table option] click [layout and format]
Find [Automatically adjust the column width when updated] to hook off the pair, and it will not automatically adjust the column width
Find the [Reserved Unit Format at the Updated] to hook the pair, and you will not automatically adjust the format
The above is the common technique of the 8 data perspective tables shared today. How many have you encountered?
I am Excel from zero to one, follow me, and continue to share more Excel skills

- END -
Chang'e -4 completed the 4th day of the day to enter the 4th April night to sleep

Original title: Chang'e-4 completed the 44th day of work, research results reveali...
What is the fastest growing plant in the world?

It, Linchi, like jade, rushing to change the festival, and the heart of Zhen.It is...