How to use data to measure value with data?
Author:Everyone is a product manager Time:2022.06.08
Editor: Many B -end product managers may want to know, how to use data to measure the value of B -end products? This article will tell about the dimensions of business attributes, tool attributes, product competitiveness and user satisfaction, and I hope it will be helpful to you.

When the business is required, will you confuse whether to pick up this demand?
When reporting and resume writing during the stage, will you feel at a loss about value measuring?
When the interviewer is asked and talked about the key indicators of your products, would you be stunned?
It is difficult to quantify the value of B -end products, which is the common pain point of B -end product managers.
So how to quantify it?
This article will provide you with some references through business attributes, tool attributes, product competitiveness and user satisfaction.
1. Business attribute data indicators
In the long run, products can continue and develop positive, and they need to realize better commercialization.
Otherwise, when the financing of financing is completed, the commercialization is unsuccessful, and the team will dissolve on the spot.
So how to measure it?
Based on product sales methods, such as terminal user number subscriptions, module subscriptions or buying, etc., we can calculate the product's business attribute index -new purchase and renewal.
New data purchased by the product, for example, the monthly purchase increase and decrease value of the monthly product, and the newly purchased data product renewal data, such as the increase or decrease of the month and annual product renewal, the year -on -year data of the renewal, of course, most of the product managers are. There is no need to carry commercial data indicators in the position positioning, but this does not mean that it doesn't matter.
If your department does not look at these indicators, you can find the data source by yourself, estimate, or find a colleague who is responsible for analyzing business attributes to discuss.
If you have some explorations and conclusions, you can talk to leaders.
2. Tool attribute data indicators
The tool attribute direction of B -end products is the cost of reducing costs and efficiency. How to reflect the success of cost reduction and efficiency?
1. Activity/Use Preference
Whether the product is used, whether it is continuously used, and what preferences are in use.
The first is the active number of enterprises/users. We can determine the frequency of the product to determine which time or the time dimension is better. If it is a product that needs to be used daily Calculation;
Secondly, the retention rate of enterprise/user can also confirm the time dimension based on the frequency of product use.
The third is the user's preferences, such as the penetration rate of a single function in all functions, the number/person ratio of different functions, to digThe frequency and preferences of users in different functions in the product.
2. The core problem that the product wants to solve is measured by data indicators
Based on the core value of the product, we can set the core indicators, the dimension includes ratio and value.
For example, an approval tool, the core data is the approval rate, whether the user enters the approval page to complete the approval as expected, and the interrupt approval will lead to a low completion rate, which needs to be attributed. This is the first type - -ratio.
Followed by the average approval time, different classification of users with an average duration, whether it is stable or reduced, or a large fluctuation.
This is the second, values, and more often measured through the costs of duration, money, such as the reduced labor cost time on the critical links.
The basis of these data is to have a buried point. You can use a third -party data buried point platform or the company to build it by itself.
What should I do if there is no buried point?
Planning and expectation can be designed if you formulate a data verification value system by yourself?
When there is no standard, try to specify the rules yourself.
3. Product stability
There is also a key indicator of B -end products, which is stability.
Enterprise products may be an important part of work and production. Once it is not available, it will inevitably affect a greater impact.
It is necessary to do well, nor will it be praised, and it will be hanged if it is not done well.
It can be calculated according to the product stability rate, that is, the normal use time/period of the product, or the number of times the number of BUG appears in different classification bugs for a period of time.
3. Use data to display product competitiveness
In the situation of product homogeneity, why customers choose to buy your product and why users like your product experience more.
An important factor is that the product has strong competitiveness and advantages compared to competing products.
You can think about himself as a former colleague, to sell this product to customers, how to convince him to believe in your product.
Or think about attracting users to the homepage of your website, how to attract him to try and buy your product.
How to impress customers and users?
Here is the third value measurement data indicator that we want to say -product function competitiveness.
The first is the core function and scene of the same type of product.
These can reflect the maturity of the product, and what they have made for the maturity of the product;
The second one is the differentiated function and scene of its own products in the same type of product. The quantity and quantityHow is the ratio.
These reflect the unique advantages of the product, which is the value of the current product stronger than the competitors.
The above product function, if it can supplement some core data indicators, it is even better.
4. User satisfaction and NPS data indicators
In product practice, the data of business attributes and tool attributes may be relatively difficult to obtain and get effective practice.
At this time, you can choose a relatively simpler data verification method -user satisfaction and NPS.
User satisfaction, we can design questionnaires based on product, module or functional dimension.
Let customers score these dimensions and compare them stage to determine the degree of optimization and satisfaction of the product.
Net recommendation value (NPS, NetPromoter Score), whether customers are willing to recommend this product to others.
According to 1 ~ 10 points, quantitatively, 1 ~ 6 are derogatory people, 7, 8 are passive, 9, 10 as the recommender.
NPS is equal to the number of recommenders minus the number of derogatory people, and then divide the ratio of the total sample number.
Those who are interested in this can directly search NPS, and there are also ready -made tools for third -party companies.
Fifth, Summary
Summarize, several dimensions of the data of B -end product data:
Tool attribute data indicators, such as the use data and penetration rate of core functions Wait, it is enough to prove that the product has sufficient active users, and it is effective in reducing costs and efficiency, which laid a solid foundation for the user value of the product.
Secondly, the user value can be proved by user satisfaction and NPS.
The product competitiveness determines the upper limit of the product development. In the face of customers with the same portrait, people have no self, and people have me. In the vertical field, whether our products have sufficient competitiveness. This determines how far and high the product development can go, and this is also reflected in the commercial value of the product, that is, the commercial attribute data indicator.
I hope it will be helpful to you, welcome to discuss ~
This article was originally published by @will Huang Xuelin to everyone as a product manager. The title map comes from Unsplash, based on the CC0 protocol
- END -
43 smart bus platforms of Langfang Linkong Economic Zone are about to be put into use
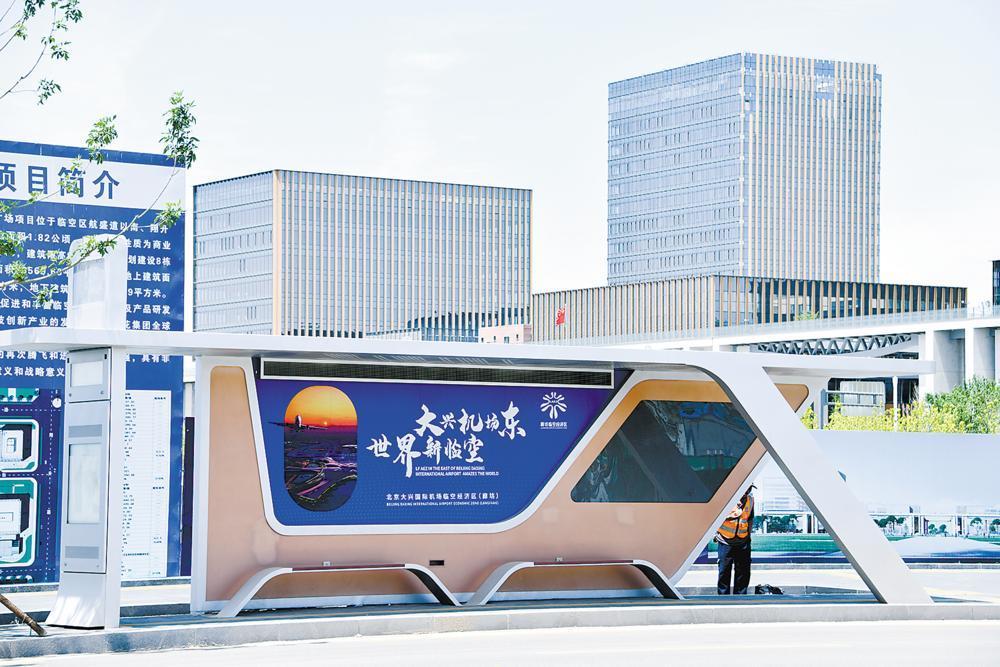
Langfang Ling Air Economic Zone smart bus platform. Correspondent Liu Yan PhotoWit...
The Team of Lanzhou University Information College successfully developed high throughput pseudo -random random generators
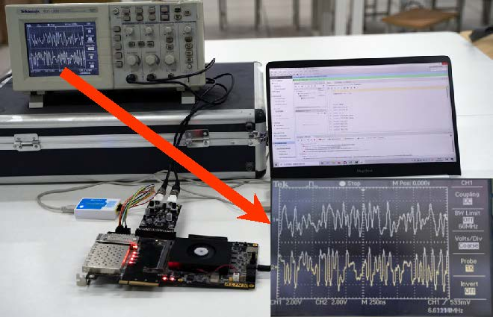
The random sequence in engineering technology is generally generated by the pseudo...