Zhang Wenchao et al. -NC: The results of the new world temperature reconstruction revealed that the northern hemisphere winter and summer temperatures were the warmest 7,000 years ago
Author:Institute of Geological Earth Time:2022.09.17


Since the industrial revolution, global warming has deeply affected the sustainable development of the earth's environment and human society. Due to the limitedness of the duration of the instrumental test, it is impossible to comprehensively obtain the laws of the earth's climate system, so the use of geological records to extend the history of climate change, combined with the climate model simulation, the law of comprehensive understanding of the evolution of the earth's climate system, its mechanism, the assessment of the climate model and the assessment of climate model Future climate prediction is important.
At present, the new world (~ 11.7 ka BP) of geological record reconstruction and climate simulation has a significant difference in annual average temperature changes in the world (LiU et al., 2014). Reconstruction has shown that the average annual temperature is the warmest from today to 10-6 KA BP (the "New World Warm Warrior period"), and then gradually becomes cold. The global warming since the industrial revolution reversed the trend of turning cold (Marcott ET Al., 2013; Kaufman et al., 2020; zhang et al., 2022); while the an antique simulation shows that the average annual temperature shows the overall temperature increase trend of the new world. et al., 2014; Bova et al., 2021; Osman et al., 2021). The huge differences in the above temperature changes have challenged the accuracy of the past climate reconstruction and model simulation. The real scene of the world temperature changes and its driving mechanism has become one of the focus of the study of the climate.
The reason for the above difference is that on the one hand, it may be related to the seasonal deviation of the climate indicators (bova et al., 2021). Because most of the biological growth biases are biased in summer, it may cause biological indicators to reflect more information about summer temperature changes; At present, there is no reliable, large -scale seasonal temperature evidence. On the other hand, it may be related to the simulation deviation of the climate model. Although the climate mode can better simulate the current temperature change at a short time, how to respond to seasonal solar radiation in the longer track time scale, the global climate system responds to seasonal solar radiation Drive factors such as atmospheric CO2 and ice volume changes, in -depth research needs to be carried out urgently.
Dr. Zhang Wenchao's post -doctoral and cooperative tutor Wu Haibin of the Institute of Geology and Earth Physics, the Institute of Geology and Earth Physics of the Chinese Academy of Sciences, and Dr. Yu Yan Yan, Dr. Li Qin and Dr. Geng Yan, Professor Cheng Jun of Nanjing Information Engineering University, Nanjing University Luhua Luhua Professor Yu and Associate Researcher Sun Yong of the Qinghai -Tibet Plateau Institute of the Chinese Academy of Sciences, based on the three methods covering 1310 spore powder records of high -quality northern hemisphere (Figure 1), using the three methods of modern analogy, conversion function and enhancement of the return tree model, the northern hemisphere was reconstructed quantitatively The history of the new and seasonal temperature of the land is a systematic comparison with the changing history of the annual mild seasonal temperature, and it is systematically compared with the TRACE-21KA.
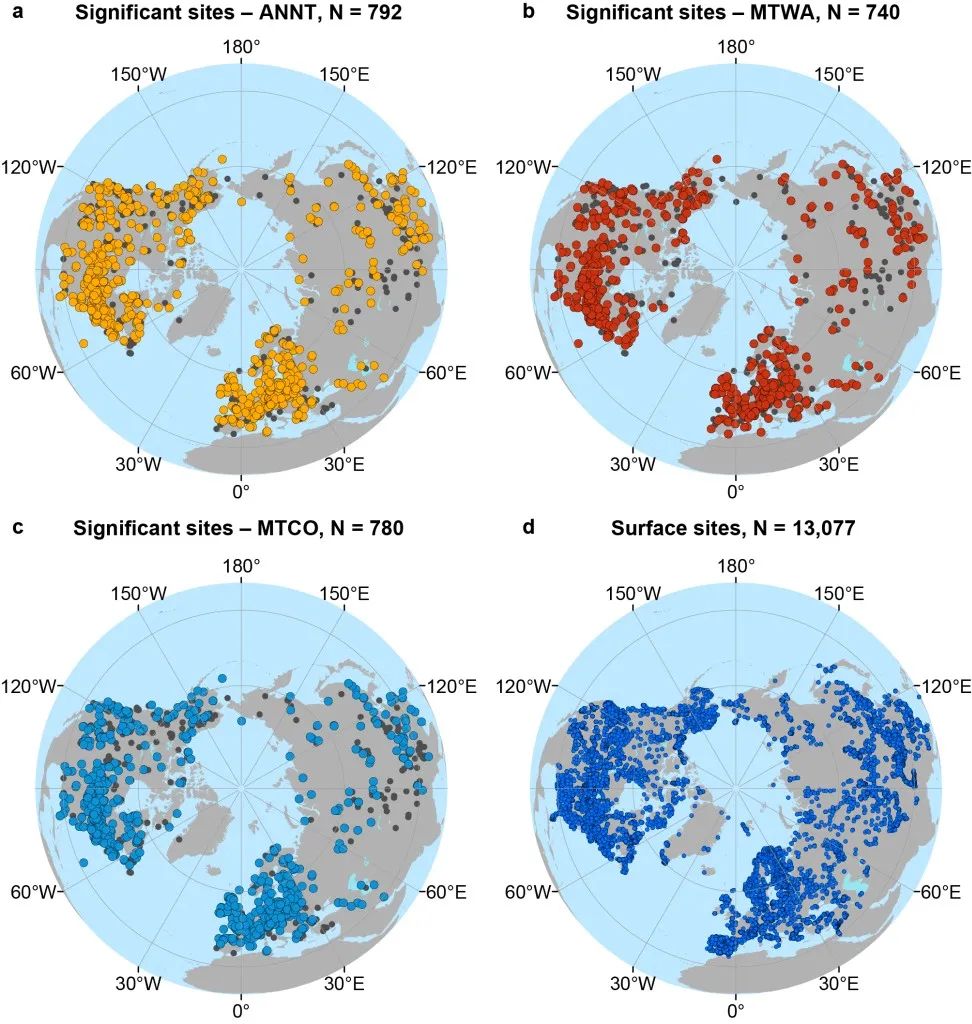
Figure 1 The new World spore powder sequence of the northern hemisphere and the spatial spatial space of the surface soil spore powder. (A-C) The annual average temperature, summer temperature, and winter temperature reconstruction point of the annual average temperature, summer temperature, and winter temperature reconstruction point are respectively.
The reconstruction results show that, as a whole, the average annual temperature of the northern hemisphere, summer and winter temperatures show the characteristics of the early-mid-new world of the new world-night new world slow cooling. The seasonal temperature changes are synchronized. ~ 7ka BP) is the warmest period in the northern hemisphere (Figure 2). Studies have also found that temperature changes have significant space differences. The early heating trend of the new world in the morning-China-China new world mainly occurs in eastern North America, Europe, and northern Asia. The trend of long -term warming (Figure 3 and Figure 4).
The comparison of the reconstruction results and the TRACE-21KA transient simulation results further show that the climate mode can better simulate the warming trend of the early-year mild and seasonal temperature of the northern hemisphere (Figure 2 and Figure 3). This trend is mainly attributed to In the northern hemisphere, the ice cover is melted (Figure 5); the mode can also better simulate the cooling trend of the summer temperature in the mid-night in the mid-night (Figure 2 and Figure 4), revealing that summer solar radiation is its control factors (Figure 5) ; But the current climate model cannot accurately reappear the cooling trend of the medium-night-time temperature in the middle of the year (Figure 2 and Figure 4).
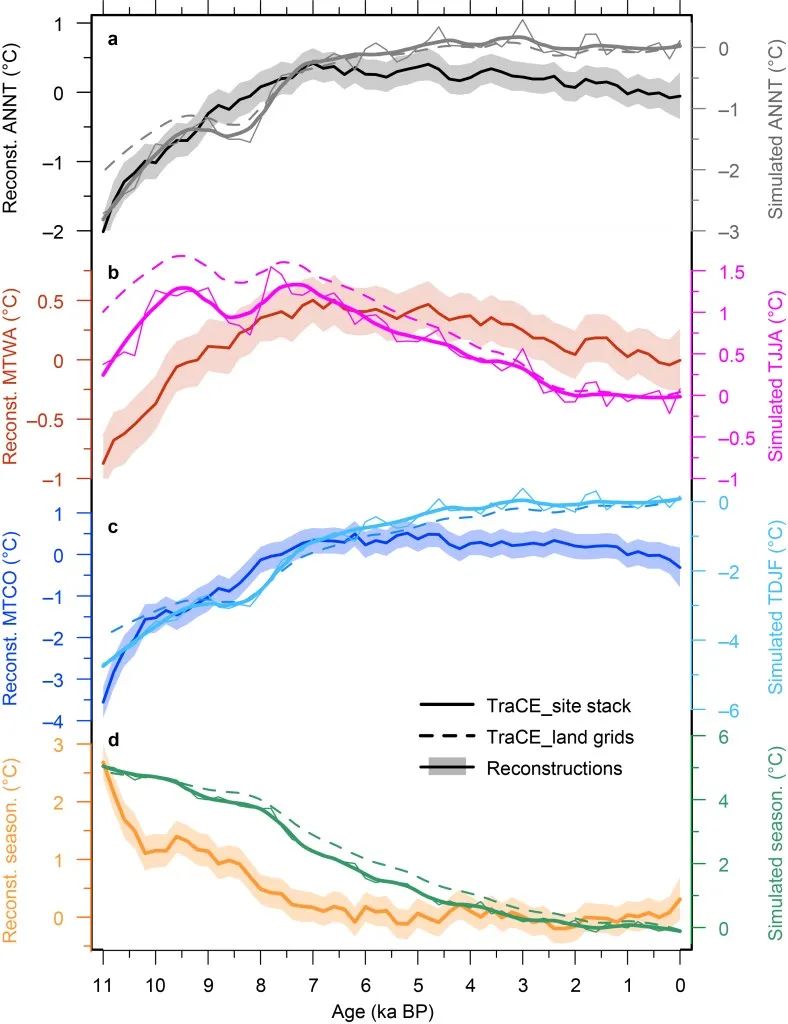
Figure 2 Comparison of the new world temperature change reconstruction results of the northern hemisphere and its comparison with the climate mode simulation results (Trace-21ka). (A) Average annual temperature; (b) summer temperature; (C) winter temperature; (d) seasonal changes in temperature (that is, the difference between summer and winter temperature)
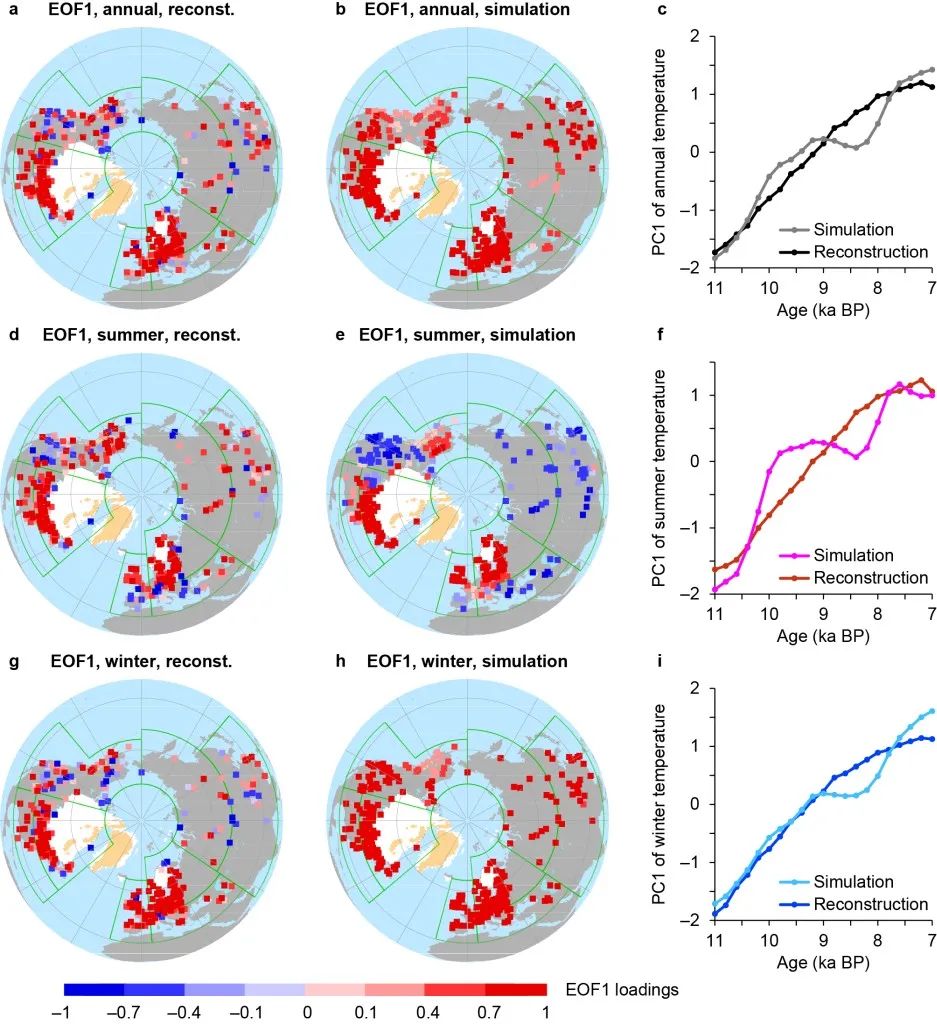
Figure 3 Early-Zhongxin New World (11-7 KA BP) temperature changes revealed by EOF analysis. (A, D, G) The temperature and spatial pattern of the annual average, summer and winter of reconstruction; (B, E, H) are the average annual, summer, and winter temperature space pattern of simulation; (C, F, I) respectively In order to correspond to the annual average, summer and winter temperature PC1 time sequence. The interpretation volume of the variance of the annual average, summer and winter temperature PC1 is 58%, 52%, and 58%, respectively, while the interpretation of the variance of the analog is 92%, 76%, and 92%Figure 4 EOF analysis. New World (7-0 KA BP) temperature change space pattern. (A-I) Figure 3. The interpretation volume of the variance of the annual average, summer and winter temperature PC1 is 36%, 31%, and 42%, while the interpretation volume of the simulation variance is 47%, 86%, and 66%, respectively
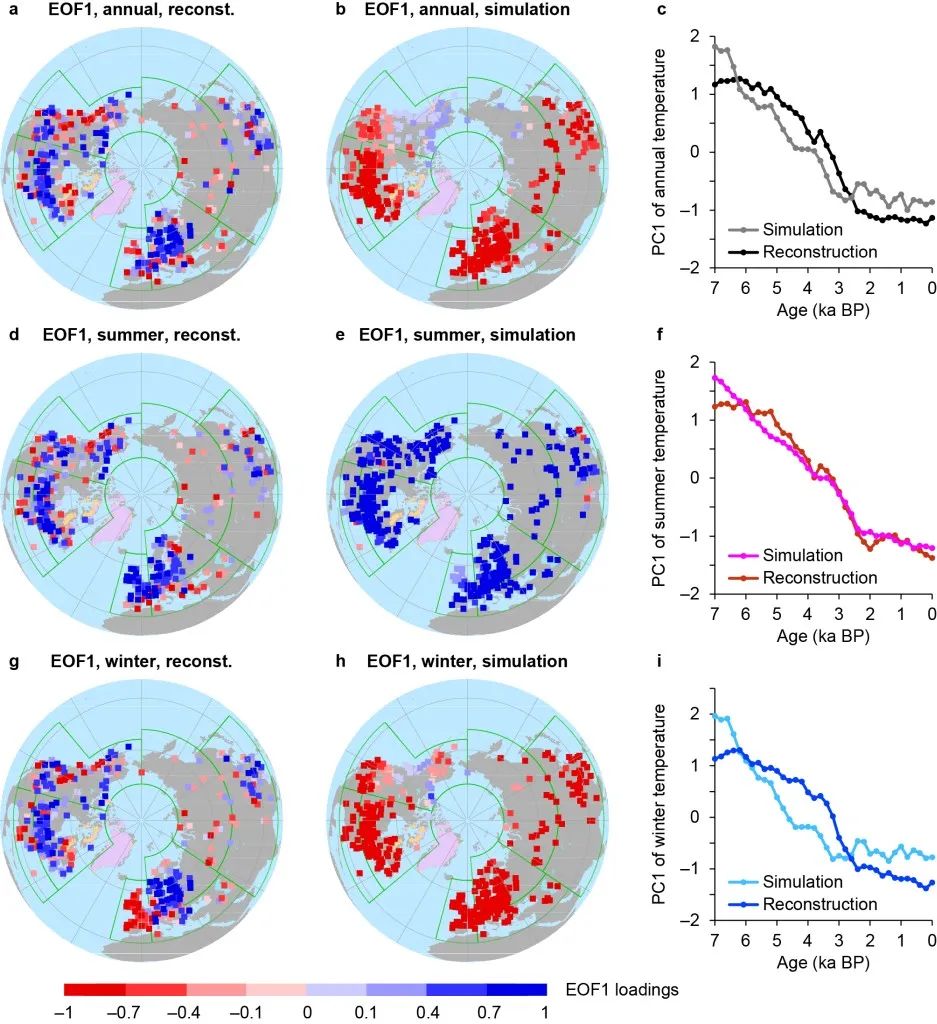
Figure 5 The climate mode single forced simulation test (Trace-21ka) contributes to different climate factor to the temperature change of the new world. (A) Average annual temperature; (b) summer temperature; (C) winter temperature; (d) seasonal changes in temperature. ORB: Earth track parameters (solar radiation); ICE: ice cover; GHG: large temperature room gas concentration; mwf: freshwater injection; ALL: full forced simulation; reconst.
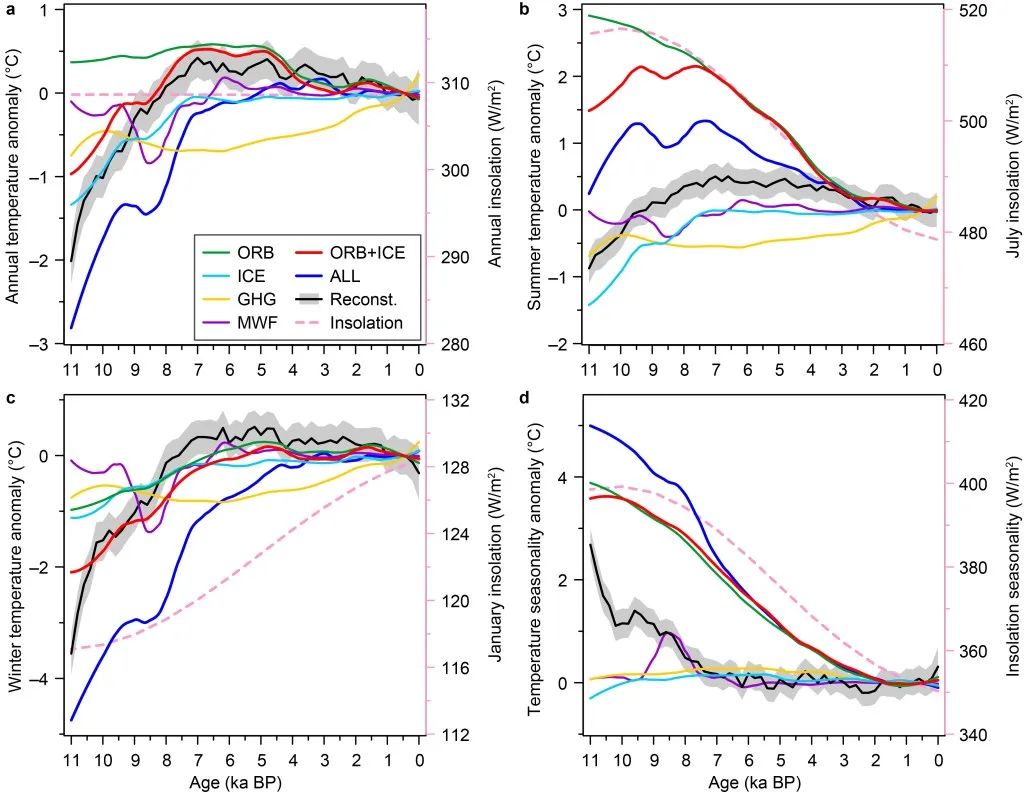
From the perspective of seasonal and spatial patterns, this study pointed out that the seasonal deviation of the reconstruction indicator is not the main reason for the "new world temperature puzzle". The reconstruction results support the summer solar radiation in the northern hemisphere may be feedback through various climate systems such as vegetation, sea ice, and the average temperature changes in winter and annual temperatures across the season. Uncertainty, it is urgent to strengthen the research on the process and mechanism of the climate system.
Research results published in the international academic journal Nature Communications [J]. Nature Communications, 2022, 13 (1): 5334. Doi: 10.1038/S41467-022-33107-0). Studies were jointly funded by many projects such as the National Key R & D plan (2020yFa0607700, 2016yFa06006006004), the Strategic Pilot Science and Technology Special of the Chinese Academy of Sciences (XDB26000000), and the National Natural Science Foundation of China (41888101, 42177180, 41807424, 41572165, 41690114).
Beauty editor: Fu Shixu

School pair: Wanpeng
- END -
The Sixth World Intelligent Conference: a new mode of smart pension for the "Tianjin Plan"

Last year I returned to my hometown to visit relatives. Because I didn't have a lo...
Early Asset Road | Google Data Center exploded; Haier Group: It is not true to launch its own brand car matters.

The explosion of Google Data Center caused 3 people to be injuredAt noon on the 8t...