The Ministry of Ecology and Environment notified the national environmental air quality status from July and January to July
Author:Ecological environment Time:2022.08.31

The Ministry of Ecology and Environment notified the media today the national environmental air quality status from July and January -July.
air quality
Overall situation
In July, the average number of days of excellent air quality in 339 prefecture -level and above cities nationwide was 89.0%, a decrease of 3.5 percentage points year -on -year; the average PM2.5 concentration was 16 micrograms/cubic meter, which was flat year -on -year; the average PM10 concentration was 32 micrograms/cubic cubic cubic cubic cubic cubic cubic cubic cubic cubic Mi, an increase of 3.2%year -on -year; the average concentration of O3 was 146 micrograms/cubic meter, an increase of 5.0%year -on -year; the average concentration of the SO2 was 7 micrograms/cubic meter, which was flat year -on -year; The concentration is 0.7 mg/cubic meter, which is the same year -on -year.
From January to July, the average number of air quality in 339 prefecture -level and above cities across the country was 85.3%, a year -on -year decrease of 0.2 percent 51 micrograms/cubic meter, a year -on -year decrease of 8.9%; the average concentration of O3 was 146 micrograms/cubic meter, an increase of 4.3%year -on -year; the average concentration of SO2 was 9 micrograms/cubic meter, a year -on -year decrease of 10.0%; NO2 average concentration was 20 micrograms/cubic meter meter , Year -on -year decreased by 13.0%; the average concentration of CO was 1.1 mg/cubic meter, which was flat year -on -year.
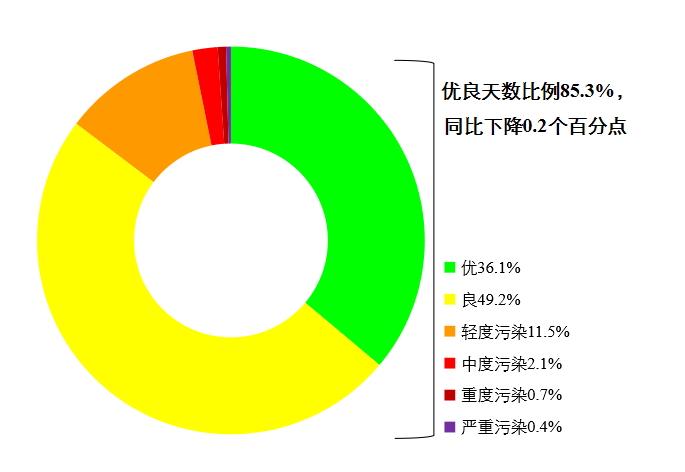
Figure 1 From January 2022 to July, 339 prefecture -level and above cities at all levels ratio ratio ratio
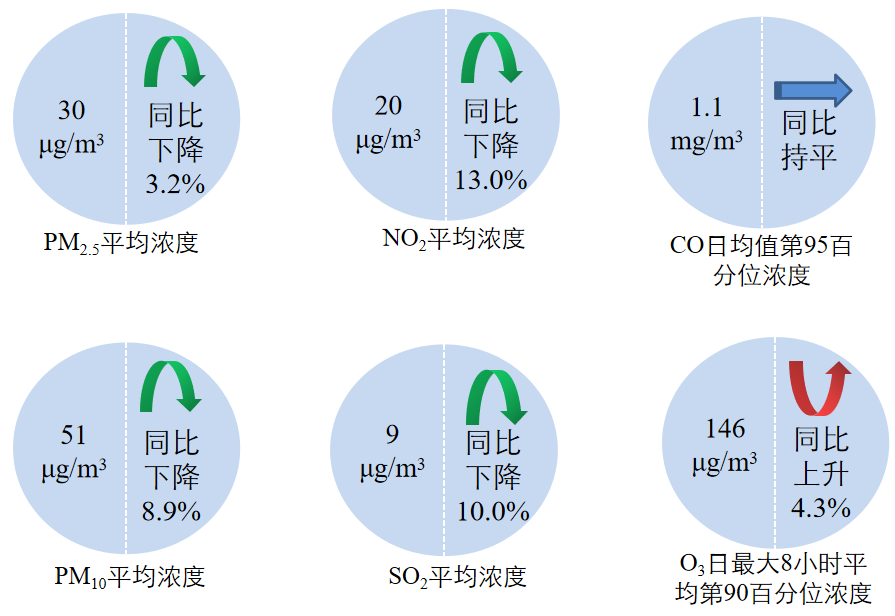
Figure 2 January to July 2022 National 339 prefecture -level and above cities with six indicators concentrations and changes in the year -on -year changes
Key areas
In July, the average number of excellent days of "2+26" cities in Beijing, Tianjin, Hebei and surrounding areas was 69.0%, a year -on -year decrease of 2.1 percentage points; PM2.5 concentration was 23 micrograms/cubic meter, an increase of 9.5%year -on -year; Micro/cubic meter, a year -on -year decrease of 4.2%. From January to July, the average number of excellent days was 62.2%, a year -on -year increase of 0.9 percentage points; PM2.5 concentration was 43 micrograms/cubic meter, a year -on -year decrease of 2.3%; the average concentration of O3 was 186 micrograms/cubic meter, an increase of 2.8%year -on -year.
The proportion of excellent days in Beijing in July was 74.2%, a year -on -year decrease of 9.7 percentage points; PM2.5 concentration was 19 micrograms/cubic meters, an increase of 18.8%year -on -year; the average concentration of O3 was 182 micrograms/cubic meter, a year -on -year increase of 5.8%. From January to July, the proportion of excellent days was 77.4%, a year -on -year increase of 6.6 percentage points; PM2.5 concentration was 29 micrograms/cubic meters, a year -on -year decrease of 21.6%; the average concentration of O3 was 187 micrograms/cubic meter, an increase of 19.9%year -on -year.
The average number of excellent days in the 41 cities in the Yangtze River Delta in July was 86.6%, a year -on -year decrease of 9.0 percentage points; PM2.5 concentration was 17 micrograms/cubic meters, an increase of 21.4%year -on -year; the average concentration of O3 was 162 micrograms/cubic meter, an increase of rising year -on -year, a year -on -year increase of increase 19.1%. From January to July, the average number of excellent days was 80.2%, a year -on -year decrease of 6.0 percentage points; PM2.5 concentration was 32 micrograms/cubic meter, an increase of 3.2%year -on -year; the average concentration of O3 was 164 micrograms/cubic meter, a year -on -year increase of 7.9%.
The average number of excellent days in July in the 11 cities of the Fenwei Plain was 67.1%, a year -on -year decrease of 0.9 percentage points; the PM2.5 concentration was 21 micrograms/cubic meter, a year -on -year increase of 5.0%; the average concentration of O3 was 187 micrograms/cubic meter, a decrease of year -on -year decrease 1.1%. From January to July, the average number of excellent days was 59.6%, a year -on -year decrease of 4.5 percentage points; PM2.5 concentration was 45 micrograms/cubic meter, an increase of 4.7%year -on -year; the average concentration of O3 was 177 micrograms/cubic meter, a year -on -year decrease of 0.6%.
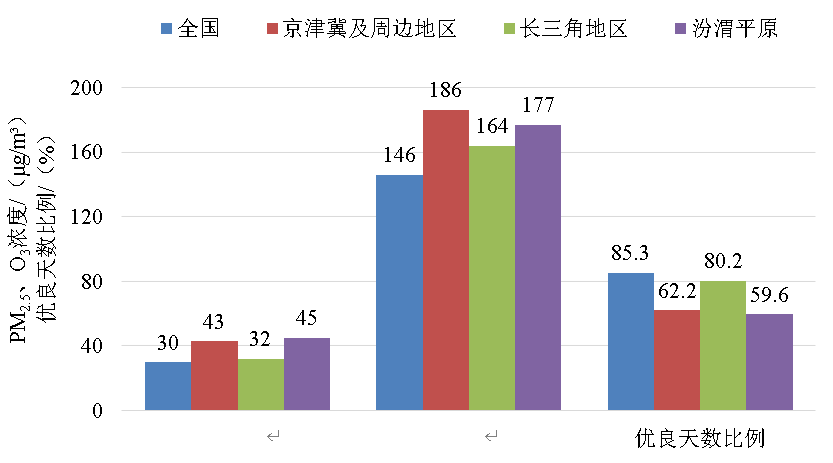
Figure 3 From January to July 2022, the air quality comparison of the nation and key areas
Key city ranking
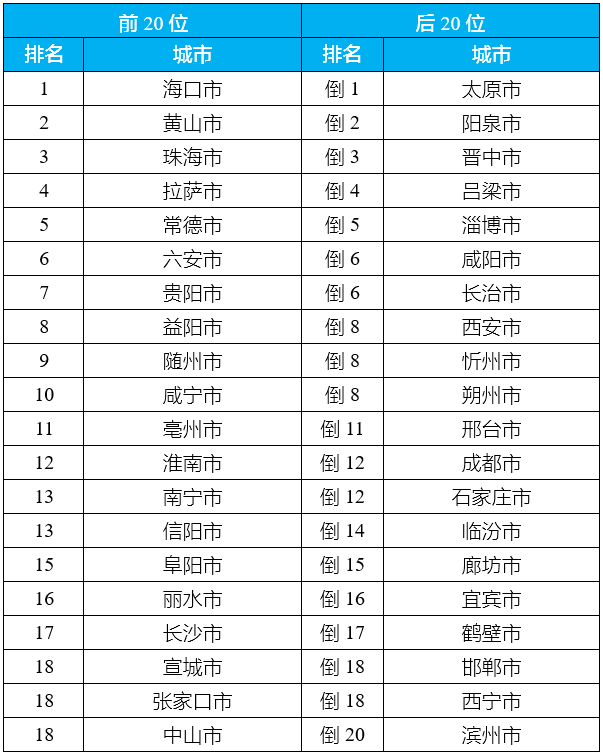
In July, of the 168 key cities, 20 cities including Haikou, Huangshan, and Zhuhai City were relatively good (from the first place to the 18th place); the air quality in 20 cities including Taiyuan, Yangquan, and Jinzhong Poor (from the penultimate to the 20th place), see Table 1.
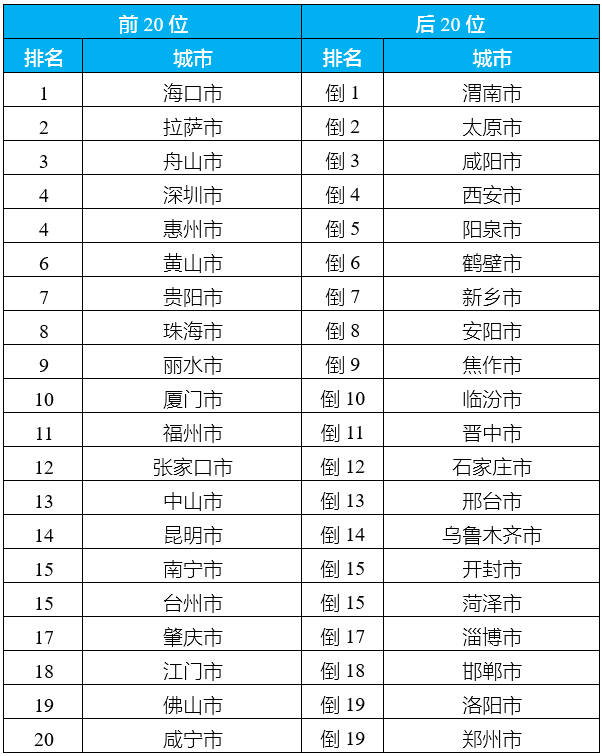
From January to July, of the 168 key cities, 20 cities including Haikou, Lhasa, and Zhoushan City were relatively good (from the first to 20th); The poor (from the penultimate to the 19th place to the 19th place), see Table 2.
Attachment 1
In the 168 key cities in July 2022, air quality
Ranking the top 20 and post -20 cities list
Attach Table 2
From January 2022 to July 168 key cities air quality
Ranking the top 20 and post -20 cities list
- END -
Sudden!Fushun a woman fainted with heat stroke, and the medical staff rescued urgently ...

Girls fainted with heat strokeMedical staff fully rescueWhat is warmer than the sc...
Welfare at the end of the article | When you meet a flood in the wild, you can keep your life in understanding this knowledge!

Recently, rainstorms are a period of high incidence of mountain floods and mudslid...