Use the principle and application of random forest evaluation characteristics
Author:Data School Thu Time:2022.09.13

Source: Machine Learning Institute
This article is about 2000 words, it is recommended to read 8 minutes
This article makes a brief introduction to how random forests are used for feature selection.
The random forest is an integrated learning algorithm based on decision -making trees. The random forest is very simple, easy to achieve, and the calculation expenses are very small. What is even more amazing is that it shows very amazing performance in classification and return. Therefore, random forests are also known as "the method of integrated learning technology level. "".
1. Introduction to random forest RF
As long as the algorithm of the decision tree, the random forest is quite easy to understand. The algorithm of the random forest can be summarized in the following steps:
Use Bootstrap to select N samples from the samples as a training set.
Given a decision tree with a sample set. Each node generated:
Select the D feature randomly without repeatedly;
Use this D feature to divide the sample sets to find the best division features (can be judged by the Gini coefficient, increase rate, or information gain).
Repeat steps 1 to step 2, K, K is the number of decision trees in random forests.
Use the trained random forest to predict the test sample and use the voting method to determine the results of the prediction.
The picture below shows the random forest algorithm (picture comes from literature 2):: Pictures 2):
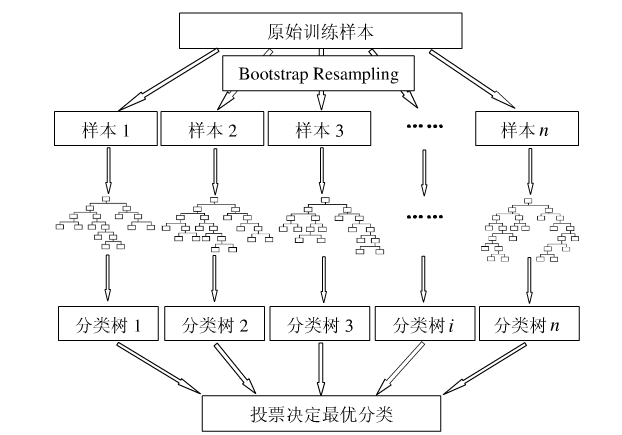
That's right, this is the algorithm of random value everywhere. It has excellent effects in classification and regression. Do you feel strong and cannot explain?
However, the focus of this article is not this, but the next feature importance assessment.
2. Evaluation of characteristic importance
In reality, a data set often has hundreds of previous features. How to choose the most features that affect the most than the result to reduce the number of features when establishing a model is a question that we are more concerned about. There are actually many methods, such as the analysis of the main component, Lasso and so on. However, what we want to introduce here is to use random forests to screen features.
The idea of using random forests for feature importance is actually very simple. To put it plainly, see how much contribution of each feature in each tree in random forests, and then take an average value, and finally compare between the features and the features. The size of the contribution.
Well, what is the saying of this contribution? It can usually be measured by the Gini Index or out -of -bag data (OOB) error rates as evaluation indicators.
Here we only introduce the method of evaluating with the Gini index. First of all, make a brief introduction to another method.
We use
Now you need to calculate each feature
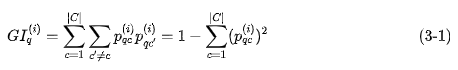
Among them,
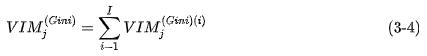
Features
Among them,
If, the features
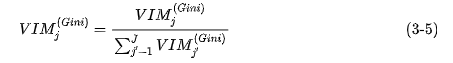
Finally, do a normalization of all the importance scores obtained.
Third, give an example
Fortunately, Sklearn has helped us encapsulate everything, and we only need to call the functions in it.
We take the example of wine on UCI as an example, first import the data set.
Import Pandas as PD url = 'http://archive.uci.edu/ml/machine-rearning-databases/wine.data' df = pd.read_csv (url, header = none) df.columns = ['class label', 'alcohol', 'malic acid', 'ash', ' Alcalinity of ash', 'Magnesium', 'Total phenols', 'Flavanoids', 'Nonflavanoid phenols', 'Proanthocyanins', 'Color intensity', 'Hue', 'OD280/OD315 of Diluted Wines', 'Proline']
Then, let's take a look at what kind of data set is this:
Import Numpy as np np.unique (df ['class label']
The output is:
Array ([1, 2, 3], dtype = int64)
It can be seen that there are 3 categories. Then look at the information of the data:
df.info ()
The output is:
Rangeindex: 178 Entries, 0 to 177 Data color (Total 14 Columns): < Code> Class Lab-NOLL INT64 Alcohol 178 Non-NULL Float64 Malic Acid 178 Non-NULL FLOAT64 Alcalinity of ASH 178 Non-NULL FLOAT64 Magnesium 178 Non-NULL INT64 Total Phenols 178 Non78 Non-Null Float64 < Nonflavanoid Phenols 178 Non-NULL FLOAT64 Pronthocyanins 178 Non-NULL FLOAT64 Color Intens. Code> Hue 178 Non NULL FLOAT64 OD280/OD315 of Diluted Wines 178 Non-NULL FLOAT64 ProLine> ProLine 178 non-null int64 DTYPES: Float64 (11), int64 (3) Memory usage: 19.5 kb A total The size of the dataset is 178. According to the regular practice, the data set is divided into training sets and test sets.
try: from sklearn.cross_validation import train_test_splitexcept: from sklearn.model_selection import train_test_splitfrom sklearn. ENSEMBLE Import RandomForestclassifier x, y = df.iloc [:, 1:]. Values, df.iloc [:,0]. Values x_Train, x_teest, y_Train, y_Testest = train_test_split(x, y, test_size = 0.3, random_state = 0)feat_labels = df.columns[1:]forest = RandomForestClassifier(n_estimators=10000, random_state=0, n_jobs = -1) Forest.fit (x_train, y_train) Okay, so that the random forest is trained, and the importance of the characteristics of the characteristics has been done well. Let's take it out.
Importances = Forest. Feature_importances /code> Print (" %2d) %-*s %f" %(f + 1, 30, feat_labels [Indices [F]], Importances [Indices [F]))
The result of the output is:
1) Color Insity 0.182483 2) Proline 0.158610 3) Flavanoids 0.150948 OD280/OD315 of Diluted 9) Malic acid 0.025400 5) Alcohol 0.106589 6) Hue 0.078243 7) Total Phenols 0.060718 8) Alcalinity of ASH 0.032033 10) Proanthocyanins 0.02235111) Magnesium 0.02207812) Nonflavanoid phenols 0.01464513) Ash 0.013916
That's so convenient. If you want to screen a variable with a high importance, you can do this:
Threshold = 0.15 x_select = x_train [:, Importances & Threshold] x_selected.shape output as:
(124, 3)
Look, is this not to help us choose the features that are more important than 0.15 ~
references
[1] Raschka S. Python Machine Learning [M]. Packt Publishing, 2015.
[2] Yang Kai, Hou Yan, Li Kang. The importance score and research progress of random forest variables [J]. 2015.
Source: https://blog.csdn.net/zjupeco/article
Author: zjupeco
Edit: Huang Jiyan
- END -
A man in Longquan Wanda Plaza strangled a woman?Police report: false information
The Longquan Station Branch of the Chengdu Public Security Bureau reported today that on July 21, a video that reflects the one man who strangled a woman in Longquan Wanda Plaza was spread on the In
"10 new" takes you to understand the report of the Zhejiang Provincial Party Congress

This morning, the 15th Party Congress of Zhejiang Province was held in Hangzhou.At...